From top-selling models to market analysis, dive
into key data and stay
informed about the dynamic automotive industry through our car sales
statistics guide.
People spend a lot of money on their vehicles. In fact, on average, an
American spends around 16% of their total budget on transportation,
including car and fuel expenses. This makes transportation the
second-largest expenditure after housing.
Given the significant investment, it's not surprising that the car sales
industry is continually changing to meet the evolving needs of buyers. In
this context, we have delved deeply into the world of car sales and shipping
statistics to provide a more comprehensive understanding of the latest
trends and developments in the industry.
Key Takeaways
The global motor
vehicle sales exceeded 81.6 million
units.
China has become
the leader of the global automotive market, with a
recorded 23.24 million automobile
registrations.
Of the overall
unit production, 72% comprised
passenger cars (61 million
units).
German auto
suppliers claimed top spots for biggest suppliers
globally.
The U.S. auto
market reached 15.9 million in
motor vehicle sales.
Ford F-Series
maintained its position as the best-selling vehicle
in the US.
The market size
of the car shipping was projected to reach
$9.9 billion in
2023.
The average cost
to ship a car in the US is approximately
$950.
In 2022, the global automotive industry witnessed noteworthy
trends and statistics that shaped the market. With
approximately 85 million motor vehicles produced worldwide,
there was a 6% increase compared to the previous year,
indicating a resilient industry overcoming challenges.
Global motor vehicle sales show signs of recovery
China has become the hub of the global automotive market,
leading in both demand and supply. In 2022, China recorded
approximately 23.2 million automobile registrations, a 10%
increase from the previous year. The US secured the second
place by recording about 14 million light vehicle sales.
This increase has contributed significantly to global motor
vehicle sales exceeding 81.6 million units.
Although there was a 1.4% year-over-year decline in global
motor vehicle sales in 2022, the market showed signs of
recovery, mainly due to the increasing demand for passenger
cars. Hence, of the overall unit production, 72% comprised
passenger cars, totaling around 61 million units.
Global passenger car sales
The passenger car market is expected to continue growing,
with a projected revenue of $1,9 billion in 2023 and an
annual growth rate (CAGR 2023-2027) of 1.72%.
By 2027, this market is estimated to reach a volume of $2
billion and witness approximately 74 million vehicle sales.
The volume-weighted average price of passenger cars is
projected to be around $28 thousand in 2023.
The United States is expected to be a key player in the
global passenger car market, generating the highest revenue
of $554 billion in 2023.
The
leading global automotive suppliers
German automotive suppliers demonstrate their global prowess,
claiming three out of the top five spots among the leading
automotive suppliers based on revenue in 2022.�
Bosch, standing at the pinnacle with 52.6 billion euros,
spearheads the list. ZF Friedrichshafen secures the third
position with 39.9 billion euros, while Continental closely
trails at fourth place with 39.4 billion euros.
Denso from Japan secured the second position with a
formidable revenue of 44.5 billion euros, and in fifth place
comes Hyundai Mobis (South Korea) with 38.2 billion euros.
US Car Sales Statistics
Due to pandemic restrictions, automotive sales volume
declined in Q2 2020 and continued to dip in 2021. Despite
signs of recovery in 2022, persistent supply chain
challenges still affect vehicle availability.
The overall price inflation has introduced disruptions to
demand. U.S. motor vehicle sales reached 14 million in 2022,
partly influenced by a decline in light truck retail sales
during that year.
However, in November 2023, light trucks, with just around
12.3 million unit sales, retained their position as the
largest segment in the U.S. auto market, reaching 15.9
million in overall motor vehicle sales. This figure
represented an impressive year-on-year increase of
approximately 13.6%.
Best-selling vehicles in the US
The top-selling vehicles in the US throughout 2022 underscore
the sustained preference for trucks and SUVs. Ford F-Series
has maintained its position as the best-selling vehicle in
the US for over four decades, with Ram Pickup and Chevrolet
Silverado also enjoying considerable popularity.
Toyota RAV4 and Honda CR-V stand out as leading choices in
the crossover SUV category, while Toyota Camry continues to
dominate as the best-selling sedan. Together, these vehicles
constituted more than 10% of the year's total new car sales
in the country.
Used
vs. new light vehicles and EVs
In the third quarter of 2023, the landscape of light vehicles
and electric vehicles (EVs) in the United States reveals
intriguing trends. With approximately 288.5 million vehicles
in operation, new registration volumes are gradually
increasing, reaching an annualized figure of 14.9 million.
On the other hand, used vehicle registrations saw a 14%
decline since 2021 due to low volumes and higher prices
impacting these transactions.
EVs and hybrids are on the rise, with Tesla still leading the
way in the EV market despite increased competition. The
market share of EVs in vehicles in operation is growing
faster than other fuel types.
Used
vs. New Light Vehicles and EVs
In the third quarter of 2023, the landscape of light vehicles
and electric vehicles (EVs) in the United States reveals
intriguing trends. With approximately 288.5 million vehicles
in operation, new registration volumes are gradually
increasing, reaching an annualized figure of 14.9 million.
On the other hand, used vehicle registrations saw a 14%
decline since 2021 due to low volumes and higher prices
impacting these transactions.
EVs and hybrids are on the rise, with Tesla still leading the
way in the EV market despite increased competition. The
market share of EVs in vehicles in operation is growing
faster than other fuel types.
Car Shipping Statistics
The car shipping industry in the US plays a substantial role
in the broader automotive landscape, with a projected market
size of $9.9 billion in 2023. This industry’s performance is
intricately linked to new car and light truck sales, where
heightened sales translate to an increased demand for
vehicle transportation, particularly from manufacturers to
dealerships and various markets, resulting in a notable
upswing in vehicle freight.
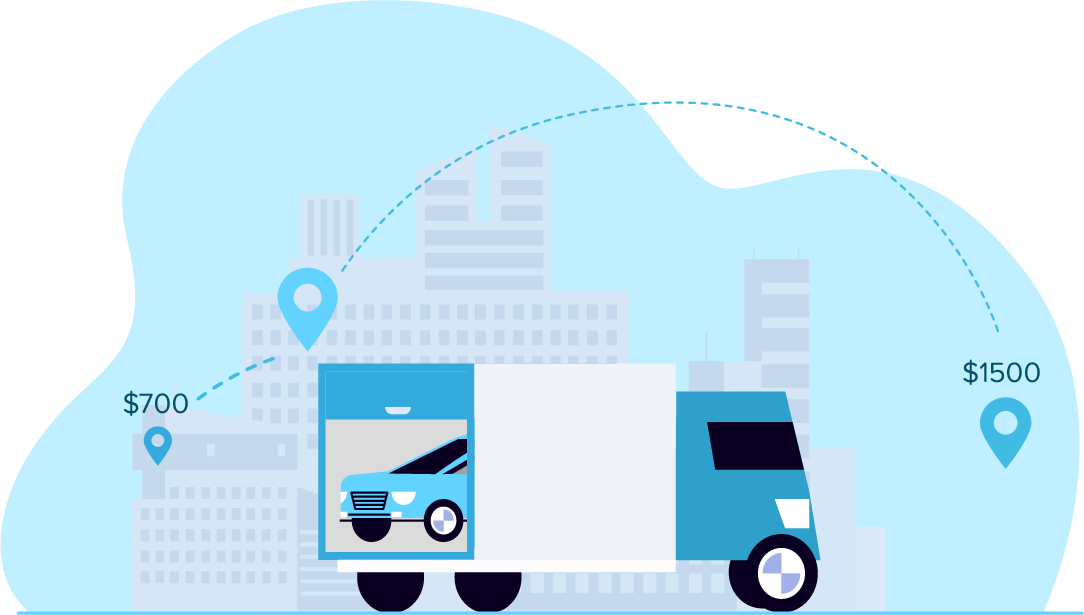
The
average cost to ship a car
Currently, the United States houses 4,848 auto transport
businesses. Each business is unique in its offerings and
prices. However, the typical cost to ship a car in the US
can be anywhere from $700 to $1500, with the average for
1000 miles being $950.
To have a clearer idea of the average shipping cost, some
factors must be considered, including the transportation
distance, the type of vehicle, and the chosen shipping
method.
Car
shipping cost per mile
The cost of car shipping per mile highly determines the
overall cost of transporting vehicles across different
distances. The average per-mile cost for 500-mile distances
ranges from $1.36 to $3.00 due to the relatively shorter
travel distance.
On the other hand, journeys exceeding 2,500 miles reduce the
cost per mile to $0.55 or $0.72, reflecting a more
economical rate for longer hauls.
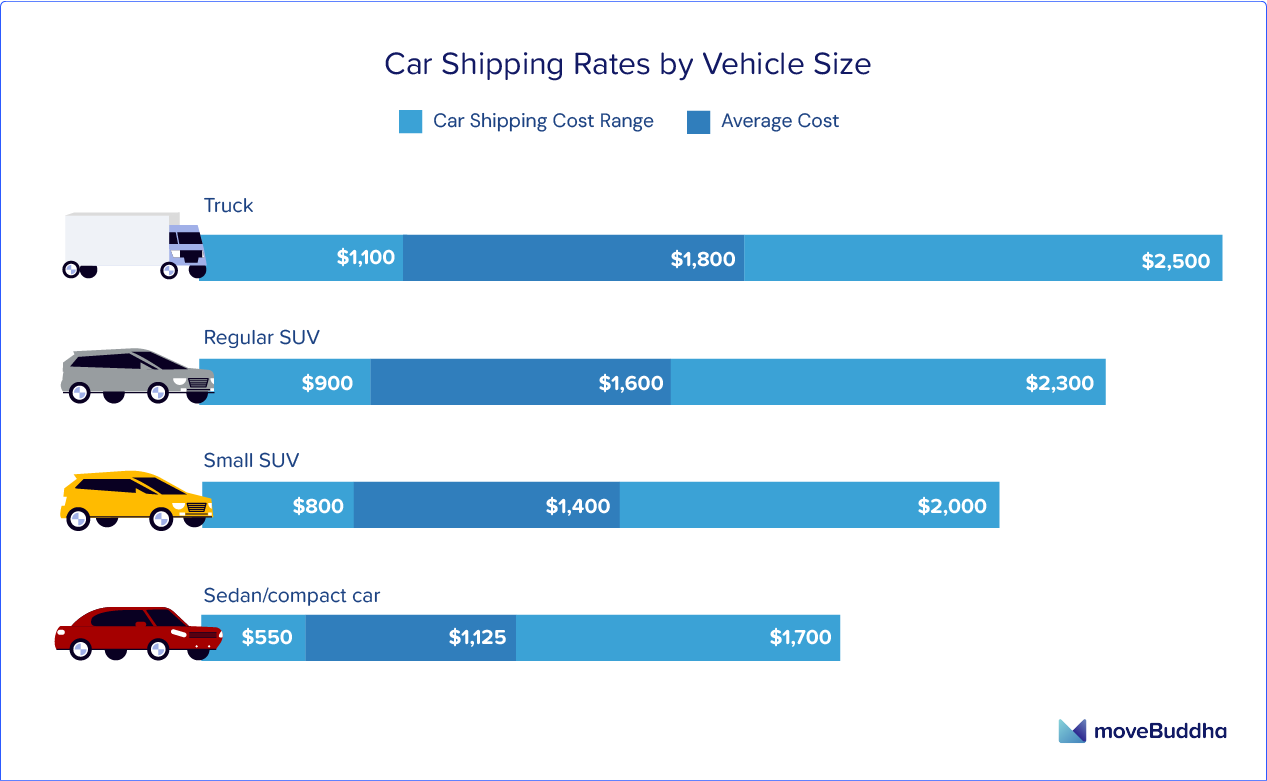
Car
shipping rates by vehicle size and type
Car shipping rates vary by the size and type of the vehicle,
with cost ranges tailored to accommodate different
automotive categories.
For sedan and compact car transportation, the shipping cost
falls within the range of $550 to $1,700, with an average
cost of $1,125. Moving up in size, for truck transport, the
cost range expands to $1,100 to $2,500, with an average cost
of $1,800.
Car
shipping rates by transport type
The chosen transport type also influences car shipping rates.
For those seeking the added protection of an enclosed
trailer, the cost falls within the range of $1,414 to
$2,085, with an average shipping rate of $1,766.
On the other hand, open car transport, which exposes vehicles
to the environmental elements during transit, comes at a
comparatively lower cost range of $1,110 to $1,885, with an
average shipping rate of $1,489, saving up to $300.
Use our free moving cost calculator to determine how much
your move will cost.
When transporting their vehicles, users usually prefer car
shipping companies with a proven track record of reliability
and efficiency based on their past positive experiences. Our
research team has compiled a comprehensive list of the top 5
car shipping companies.
For those seeking an all-encompassing solution, SGT Auto
Transport is hailed as the best overall choice, standing out
for its comprehensive and reliable services. Easy Auto Ship
earns its reputation as the best for quick pickup, catering
to those with time-sensitive transportation needs.
Montway Auto Transport is the top choice for cross-country
shipping, demonstrating efficiency and expertise in handling
long-distance vehicle transportation. Sherpa Auto Transport
is recognized as the best for individuals placing a premium
on accurate pricing, offering transparent and precise cost
estimates.
Finally, for those prioritizing insurance coverage, Ship A
Car Direct is acknowledged as the best, providing peace of
mind with comprehensive and reliable insurance options.
In
Conclusion
Despite the challenges, the automotive industry has shown
remarkable resilience over the years. In fact, global motor
vehicle sales have exceeded 81.6 million units, and data
revealed dynamic preferences for trucks and SUVs. Car
shipping also played a crucial role in the automotive
landscape, with a projected market size of $9.9 billion in
2023.
These insights provide a comprehensive view of market
dynamics and consumer preferences. As the sector evolves,
understanding these statistics is vital for industry
stakeholders and consumers navigating the complex landscape
of car sales and shipping.