
The “It” Cities are Out in 2025: The 2025-2026 moveBuddha Migration Report
In 2025, South Carolina tops inbound move searches compared to exits. And its coastal resort, Myrtle Beach, also wins the city prize for the largest share of inbound searches in the country. But what other destinations are coming for the Palmetto State’s crown, and will they really threaten its dominance in 2026?
In our 5th annual migration report, we look back on the past year and analyze half a million searches made in our moving cost estimator tool.
Unlike Census data, which is often months or a year old, this data is forward-looking and indicates where people are planning to move and also where they are moving from. From this, we analyze high-level insights at the state and city levels — we also forecast what’s likely to come next in 2026.
Here’s what we found in 2025 and what that suggests for 2026 and beyond.
Key Findings
- Micro-destinations gain 10%+ in popularity in 2025. Don’t expect to see 3 or more in-moves for every exit anywhere in 2026.
- For the first time since the pandemic, no state pulls in double the number of in-moves as out-moves, but for a 3rd year in a row, South Carolina is the #1 destination for in-moves compared to exits. It sees just shy of 2 newcomers for every exit.
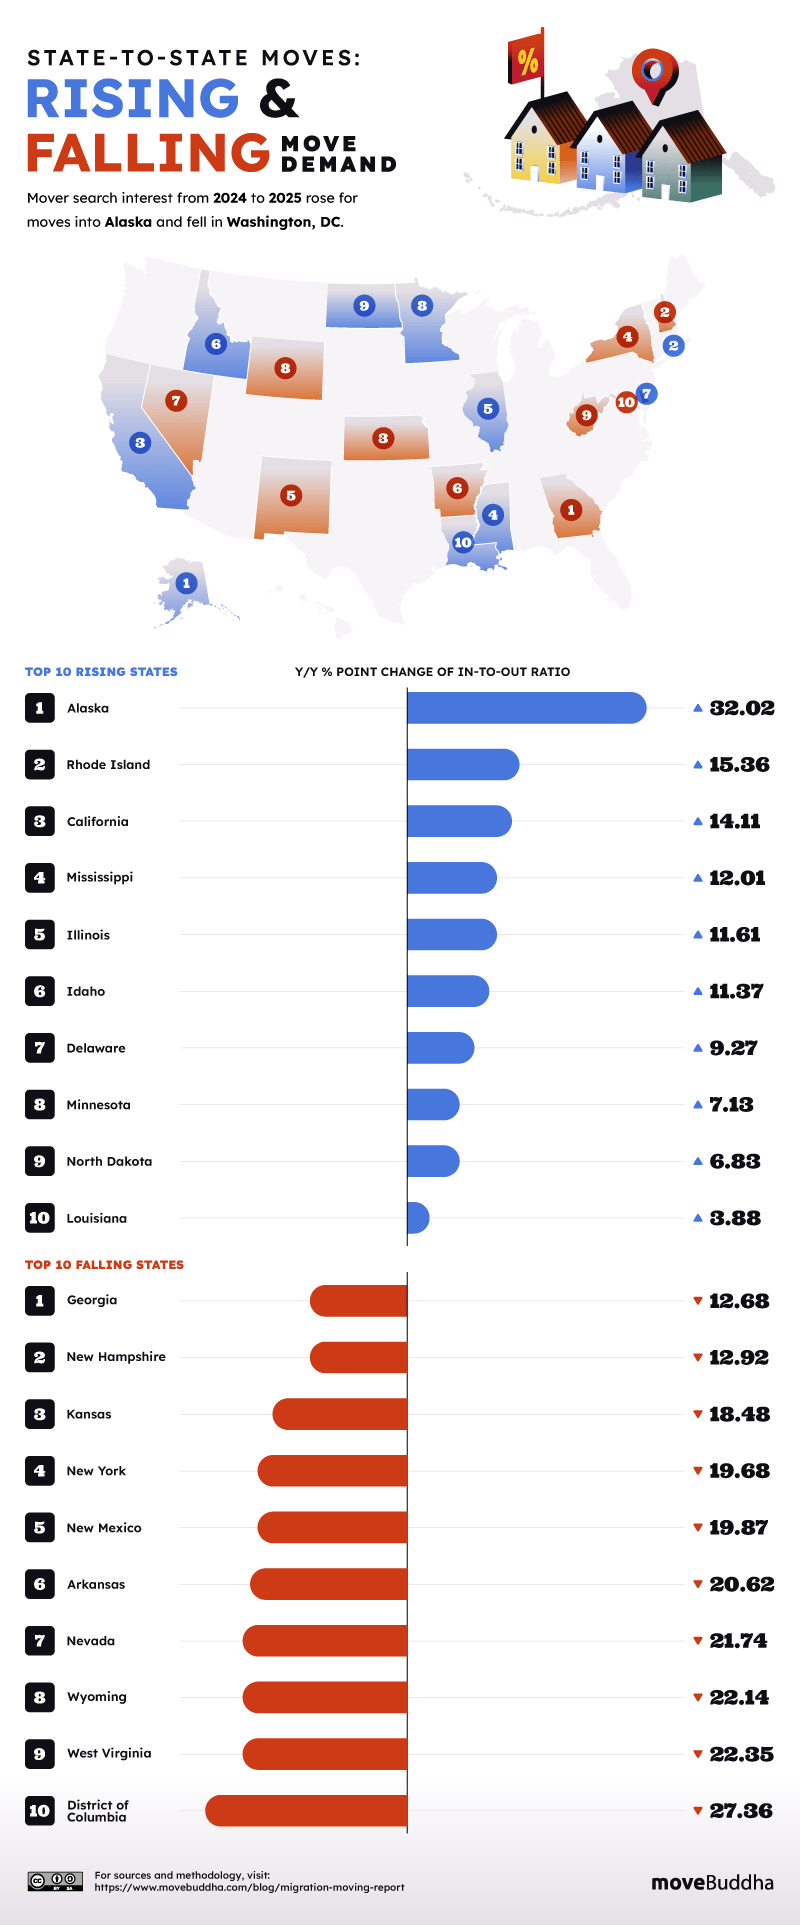
- Alaska has seen the biggest percentage increase in interest this year, with its in-to-out ratio up 32.02% from 2024.
- With 3.28 in-moves per exit, #1 Myrtle Beach is a big part of South Carolina’s buzz, outpacing the state itself for in-moves vs. out.
- 5 of the 10 most desirable cities of 2025 are in Florida, which lies outside the top 10 most desirable states. Ocala, Port St. Lucie, Palm Coast, St. Augustine, and Kissimmee, while its age-restricted enclave, The Villages, has seen the biggest decline in move interest.
- Goodbye ultra-trendy cities, and hello to a sprawl of hotspots from Bellingham, WA to Port St. Lucie, cities that lie 2,680 miles apart.
- In 2026, we forecast Alaska’s north star will keep rising. It stands to pull in an average of 2.45 new neighbors for every Alaskan calling it quits. South Dakota will see the fastest-growing surge of interest.
Table of Contents
I. Moving Patterns: Americans are Moving Less in 2025 — And Getting Pickier

In 2025, fewer Americans are moving overall. Those who do are finding there are no longer heavy-hitter destinations where “everyone” wants to go. Instead, the window is getting smaller, with less up- and down-swing as destinations find their trendiness evening out, spreading across a larger buffet of states.
Micro-Destinations Gain 10% Popularity in 2025
Today, micro-destinations are beginning to edge out the big statewide winners. Think small cities and towns that attract lots of movers even though their state is only middle of the pack.
For instance, would-be movers are finding Fort Collins, CO, and Salem, OR, great places to buy a home (as well as catch a game).
Cumming, GA, offers access to Lake Lanier lounging without suffering through Atlanta’s traffic.
Georgetown, TX, and Littleton, CO, offer big-city amenities nearby, with small downtowns and indie shops where breweries and small(er) town vibes reign.
All these spots have grown in popularity more than 10% this year. None of their states are in the top ten 2025 for in-to-out ratio.
| Cities | In-to-Out Ratio 2025 | Ratio Change 2024-2025 |
| Ocala, FL | 3.09 | 74.2% |
| Port St. Lucie, FL | 1.67 | 72.4% |
| Palm Coast, FL | 2.14 | 71.2% |
| Roseville, CA | 1.38 | 56.0% |
| Cumming, GA | 1.53 | 42.5% |
| Cape Coral, FL | 1.30 | 42.4% |
| Kissimmee, FL | 1.76 | 38.9% |
| Georgetown, TX | 1.66 | 36.0% |
| Delray Beach, FL | 1.19 | 30.8% |
| Boca Raton, FL | 1.16 | 27.5% |
| Springfield, MO | 1.29 | 22.5% |
| Jacksonville, FL | 1.35 | 22.2% |
| Alpharetta, GA | 1.28 | 21.4% |
| Salem, OR | 1.26 | 18.8% |
| Cambridge, MA | 1.05 | 18.4% |
| Austin, TX | 1.16 | 14.0% |
| Fort Collins, CO | 1.49 | 14.0% |
| Queen Creek, AZ | 1.211 | 12.2% |
| Beaverton, OR | 1.108 | 11.5% |
| Bellevue, WA | 1.054 | 10.2% |
| Oklahoma City, OK | 1.007 | 10.1% |
That means that, as popular Southern and Mountain West destinations get more crowded and unaffordable, newcomers are looking instead to replicate their favorite cities’ vibes in other places. And they’re more willing than ever to look out of state for that just-right destination.
In-to-out move ratios aren’t necessarily getting lower; after all, when someone moves out of one destination, they put down roots in another, evening out the math of state-to-state moves. But move ratios are clustering closer together, with fewer states caught in the whiplash of extreme popularity (or facing an apocalyptic exodus).
II. States – From South Carolina’s 3rd Year At the Top To Alaska’s Surge in 2025

South Carolina keeps the crown for attracting the most interest from movers, followed by Idaho and North Carolina, while Alaska surges into the spotlight. Retirees, value seekers, and off-the-beaten-trailblazers are steering state migration in 2025. Meanwhile, California and Illinois begin quiet comebacks, while Washington, D.C., suffers the steepest decline in mover interest.
What are the Most Popular States for Movers in 2025? South Carolina, Idaho, and North Carolina
For the 3rd year in a row, South Carolina reigns supreme as Americans’ top move-to destination. Its staying power is remarkably stable, too. Last year, just over 2x as many movers flooded the state as left, while from 2020 to 2023, the number fluctuated between 1.9 and 2.11.
So, while South Carolina actually has a negative birth rate and limited appeal to international migrants, its population is growing due to migration from other states, leading to a housing crunch and mixed opinions on the costs of success.
Its retirement climate is part of the appeal, with destinations best known among the golf-cart set surging strongest, and the percentage of residents over 65 rising from 13.75% in 2010 to 19.36% last year.
While South Carolina holds steady, its 1.99 in-move ratio sits atop a national dampening of “trendy” moves: it’s the first year since the COVID-19 pandemic when no state saw double the number of in-moves compared to out.
Idaho takes 2nd place this year, offering wide open spaces, along with lower costs (compared to the home states of many movers, who are looking to exit Washington and California markets).
North Carolina ranks third. Like its southern neighbor, interest is highest among older generations. But locals note that affordability, economy, lifestyle, and remote work are also driving moves.
New to the top ten this year are Alaska (debuting at #4), Delaware, and Alabama.
They displace West Virginia, Wyoming, and Montana.
| States with the highest ratio of moves in-to-out | States with the lowest ratio of moves in-to-out |
| South Carolina — 199 in to 100 out | California — 62 in to 100 out |
| Idaho — 169 in to 100 out | New Jersey — 64 in to 100 out |
| North Carolina — 166 in to 100 out | Connecticut — 67 in to 100 out |
| Alaska — 162 in to 100 out | New York — 71 in to 100 out |
| Maine — 157 in to 100 out | Maryland — 74 in to 100 out |
| Tennessee — 149 in to 100 out | District of Columbia — 74 in to 100 out |
| Delaware — 138 in to 100 out | Nebraska — 75 in to 100 out |
| South Dakota — 136 in to 100 out | Rhode Island — 79 in to 100 out |
| Arkansas — 135 in to 100 out | Massachusetts — 80 in to 100 out |
| Alabama — 133 in to 100 out | Virginia — 82 in to 100 out |
What are the Least Popular States for Movers in 2025? California, New Jersey, and Connecticut
California retains the #50 position, though it’s bleeding much less than in 2024; this year, .62 newcomers moved in compared to out — last year, that figure was .48. People are still leaving compared to arriving, but the gap is narrowing.
New Jersey holds steady at #49, with comparable outflow to 2024. Along with California and New Jersey, last year’s #47, Rhode Island, are the only bottom states to see a lift this year.
Seven of the bottom ten wind up there due to worse performance this year. Take Connecticut, which takes a dip this year, landing in spot #47. In 2024, the state saw .72 in-moves for every move out, but this year, just .67 movers stayed for each outbound move.
Other bottom states where more residents are heading out than last year, and which are all seeing more out-moves than newcomers, are Virginia, Massachusetts, Nebraska, the District of Columbia, Maryland, and New York.
Alaska Sees The Biggest Jump in 2025
Alaska’s big surge is the largest positive shock of 2025. Moving from #13 to #4, its ratio has surged from 1.30 to 1.62, the largest jump in ratio in the whole dataset, more than doubling the gains that other states have seen (with a 32% increase in move ratio). The end result? Alaska isn’t a niche destination for hunters and fishing industry workers anymore, but a legitimate refuge for adventurers tired of the lower 48.
The shift follows years of decline and gels with the advent of widespread remote work and a growing emphasis on lifestyle over big-city career ladders.
Meanwhile, longtime out-migration locales like Illinois and California are staging quiet comebacks. That’s saying something, since just 15 states saw any improvement in their move ratio this year.
The comeback cohort includes last year’s #48 Rhode Island. The tiny seaside state bounced back with a 15.36% improvement in move ratio this year — second only to Alaska.
Moving from #43 overall to #31, Illinois has logged the biggest rank improvement this year, with a ratio moving from .82 to .94 (a 11.61% improvement). It’s still losing people, but it’s much closer to breaking even.
Also notable is California’s 14.11% improvement. While it’s the 3rd largest improvement in the nation year-over-year, that hasn’t dislodged the Golden State from its #50 spot overall…but it’s a start.
Washington, D.C. Leads the Nation’s Steepest Drop in 2025 Move Interest
The biggest face-plant of 2025 comes from Washington, D.C. The District has flipped from a 1.01 ratio to .74, the most significant drop in rank in the dataset, down 27.36%.
Part of a group of dense, expensive cities that see residents leaving in droves, D.C. also saw the pattern compounded by the loss of some 200K jobs this year. Analysts concluded that the District’s fortunes “took a nosedive” in 2025 due to federal job losses that ricocheted throughout the local economy.
Perhaps displaced workers are throwing in the towel and heading to the Last Frontier.
But it’s important to contextualize the surges and slumps.
2025 has seen less move action than in years past, with far fewer Americans uprooting to new states than they did during and immediately after the COVID-19 pandemic. So while Alaska searches shifted from 1.30 to 1.62 in-moves for each exit, and D.C. tumbled from 1.01 to .74, South Dakota once saw its fortunes change from 5.4 in-moves per exit in the 3rd quarter of 2023 to 1.44 the next.
Today, we’re seeing the top ‘surge’ and ‘slump’ rates sit around 25–35%. That’s a far cry from the 73% swings we saw at the height of the migration boom.
III. Cities – Myrtle Beach and Florida Retirement Hubs Dominate Inbound Interest in 2025

Movers favor Myrtle Beach and other Southern retirement destinations in 2025, yet momentum increasingly flows toward small and mid-sized metros that mix nature, culture, and careers. Roseville, Kissimmee, Georgetown, Santa Fe, Asheville, Bellingham, Boulder, and Raleigh are turning second-ring and college-town appeal into move-to hotspots. Bakersfield and several California metros lead for exits and long-time hotspot The Villages sees a major cool-down but retains a spot in the top-10.
Which Cities are Most Popular in 2025? Retirement Havens are Only Part of the Story
With a 3.28 in-to-out ratio, Myrtle Beach is helping South Carolina stay on top when it comes to new neighbors. And who wouldn’t want to throw off their flip flops and dig their toes into miles of Atlantic beaches in the human-sized resort community of ~43K residents?
Well, young people, for one.
The “Grand Strand’s” appeal is highest among seniors, making it the fastest-growing metro for Americans over 65 in the country.
In a similar narrative, the top move destinations in 2025 are all in the South, where warm climes and single-story homes traditionally beckon to those hanging up their office lanyards and heading for the nearest fishing hole.
#2 Ocala, FL, is known as a top retirement destination, while #3 The Villages, FL, was developed as an age-restricted community where seniors must occupy most homes, and children aren’t typically allowed to live permanently.
It’s fair to assume families aren’t moving to the Villages for the schools and job opportunities.
But retirement destinations aren’t driving the entire list.
Small artistic communities with stunning nature with broad appeal, like Santa Fe, NM, and Asheville, NC, also make appearances in the top 25. College towns with mountain access like Bellingham, WA, and Boulder, CO, are there, too. And those college towns turned big-city economic powers, like Raleigh, NC, attract not only those in search of a mild winter, but a long-lived career.
In other words: while perhaps seniors are driving America’s current top move-to cities, a more nuanced narrative stands out just under the “big” numbers: the rest of America is developing a taste for small and mid-sized cities with outdoor cred across the country.
| Move-to Rank | City, State | Searches for moves in-to-out |
| 1 | Myrtle Beach, SC | 328 in to 100 out |
| 2 | Ocala, FL | 309 in to 100 out |
| 3 | The Villages, FL | 277 in to 100 out |
| 4 | Greenville, SC | 227 in to 100 out |
| 5 | Palm Coast, FL | 214 in to 100 out |
| 6 | St. Augustine, FL | 197 in to 100 out |
| 7 | Wilmington, NC | 197 in to 100 out |
| 8 | Knoxville, TN | 183 in to 100 out |
| 9 | Huntsville, AL | 180 in to 100 out |
| 10 | Kissimmee, FL | 176 in to 100 out |
| 11 | Winston-Salem, NC | 174 in to 100 out |
| 12 | Chattanooga, TN | 172 in to 100 out |
| 13 | Port St. Lucie, FL | 167 in to 100 out |
| 14 | Georgetown, TX | 166 in to 100 out |
| 15 | Santa Fe, NM | 165 in to 100 out |
| 16 | Asheville, NC | 163 in to 100 out |
| 17 | Greensboro, NC | 162 in to 100 out |
| 18 | Franklin, TN | 155 in to 100 out |
| 19 | Cumming, GA | 153 in to 100 out |
| 20 | Raleigh, NC | 152 in to 100 out |
| 21 | Fort Collins, CO | 149 in to 100 out |
| 22 | Cary, NC | 146 in to 100 out |
| 23 | Bellingham, WA | 144 in to 100 out |
| 24 | Boulder, CO | 144 in to 100 out |
| 25 | Daytona Beach, FL | 144 in to 100 out |
Which Cities Do Americans Want to Leave the Most in 2025? So Long, SoCal
Where are they leaving in favor of scenic and creative towns? More than any other city, Bakersfield, CA, is feeling emptier this year. With an in-to-out move ratio of .48, the San Joaquin Valley city joins 3 other California cities as some of the least popular real estate in the U.S.: Long Beach, Riverside, and Fresno see the highest move-out interest (compared to in-migration) in America this year.
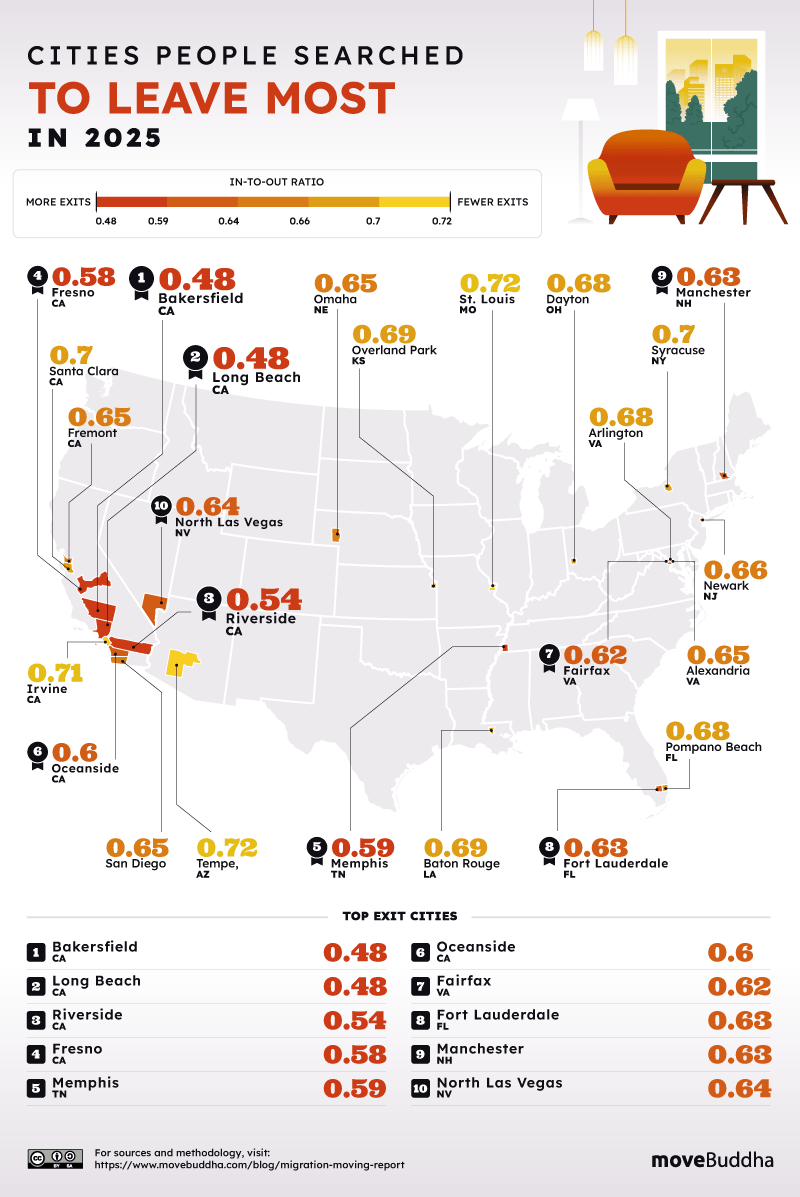
| Exit Rank | City, State | Searches for moves in-to-out |
| 1 | Bakersfield, CA | 48 in to 100 out |
| 2 | Long Beach, CA | 48 in to 100 out |
| 3 | Riverside, CA | 54 in to 100 out |
| 4 | Fresno, CA | 58 in to 100 out |
| 5 | Memphis, TN | 59 in to 100 out |
| 6 | Oceanside, CA | 60 in to 100 out |
| 7 | Fairfax, VA | 62 in to 100 out |
| 8 | Fort Lauderdale, FL | 63 in to 100 out |
| 9 | Manchester, NH | 63 in to 100 out |
| 10 | North Las Vegas, NV | 64 in to 100 out |
| 11 | Fremont, CA | 65 in to 100 out |
| 12 | Alexandria, VA | 65 in to 100 out |
| 13 | Omaha, NE | 65 in to 100 out |
| 14 | San Diego, CA | 65 in to 100 out |
| 15 | Newark, NJ | 66 in to 100 out |
| 16 | Dayton, OH | 68 in to 100 out |
| 17 | Pompano Beach, FL | 68 in to 100 out |
| 18 | Baton Rouge, LA | 69 in to 100 out |
| 19 | Overland Park, KS | 69 in to 100 out |
| 20 | Syracuse, NY | 70 in to 100 out |
| 21 | Santa Clara, CA | 70 in to 100 out |
| 22 | Arlington, VA | 70 in to 100 out |
| 23 | Irvine, CA | 71 in to 100 out |
| 24 | St. Louis, MO | 72 in to 100 out |
| 25 | Tempe, AZ | 72 in to 100 out |
Which Cities are Surging Most in 2025? A Storm of New Moves Hits Florida Towns
While South Carolina’s the nation’s most popular overall, it didn’t face a tough climb for the top spot. As it basks in its popularity, other cities are quietly charging up the ladder for the number one spot.
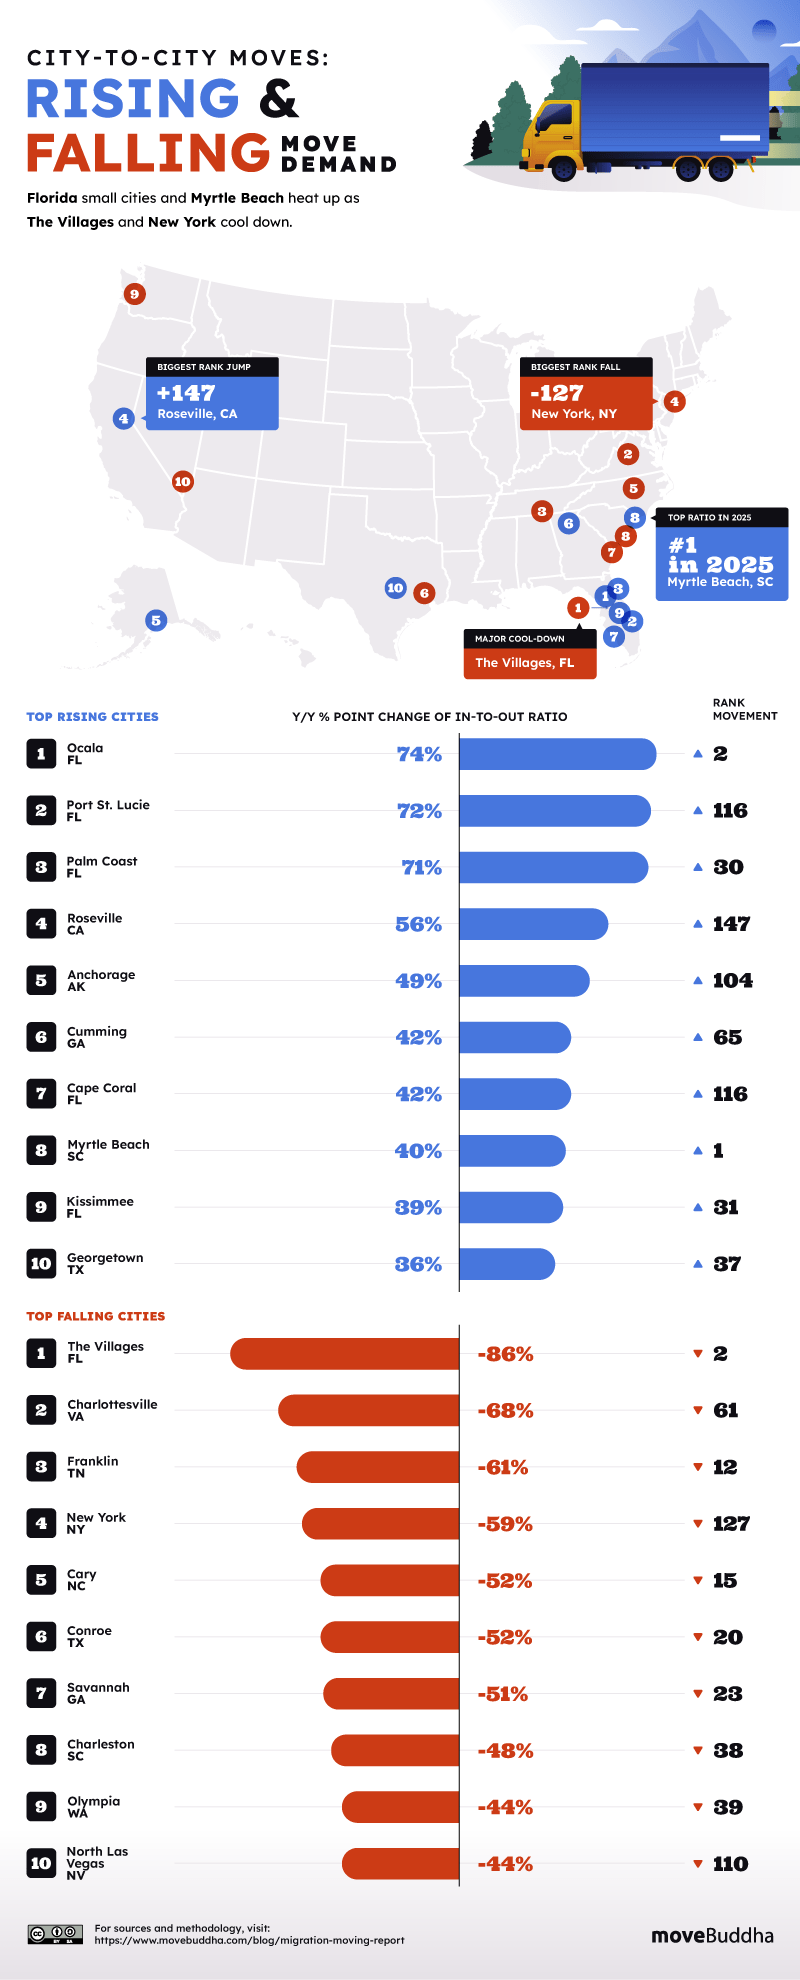
Ocala, FL, wasn’t the nation’s favorite in 2024, but this year, its in-to-out ratio has risen 74%, from 2.39 to an astronomical 3.09. Maybe that’s because it has landed on lists showcasing how to retire on a strict budget, or because its prices remain affordable compared to other Florida cities.
#2 Port St. Lucie, FL, and #3 Palm Coast, FL, have also seen 70%+ rises in their move ratios. In the case of Port St. Lucie, that’s skyrocketed its ranking up 113 places. What do all three of Florida’s most-popular have in common? They’re retirement havens, affordable compared to nearby alternatives, and off the beaten path — none are truly commutable to Florida’s largest economic centers.
Shooting up 147 places to #4, Roseville, CA, shows that California still appeals to movers from out-of-state. Like Florida’s surging cities, Roseville is still a retirement haven, but it’s also ranked as the best place to raise a family in California.
Overall, hot cities this year have been “second ring” locations outside the grip of urban price tags: Roseville, along with Cumming, GA, Kissimmee, FL, and Georgetown, TX, give movers access to airports and hybrid work arrangements even as they allow breathing room from the hustle and bustle of America’s economic centers. And that’s been a winning formula for retirees — but also many families.
Which Cities are Cooling Off in 2025? Last Year’s Hotspots are (Mostly) Still Net Positive
Funnily enough, Florida’s The Villages is the top falling city in America this year. Where 2024’s meteoric popularity made it #1, this year its in-to-out ratio has plunged 86%, leaving it barely bruised at #3 in the nation. Still one of the most popular cities, with 2.79 newcomers for every move out, the Villages has seen the apex of its popularity.
Just 2 of the cities losing the most popularity this year have landed in negative territory — both nearby major urban areas: New York City (which went from 1.38 in 2024 to .79 today) and North Las Vegas, NV (moving from 1.08 to .64).
Other big “losers” that remain net-positive are often formerly trendy spots that still hold some appeal for movers. For example, Cary, NC, has dominated move-to lists for years, along with Savannah, GA, and Olympia, WA. Their fall from grace is likely less about their desirability than about oversaturation and rising prices.
What are movers to do today? Look for the same vibes in other locations that haven’t caught on yet.
IV. 2026 Forecast: Hidden Corners Will Beat Headline States

Alaska’s spot at the top of our 2026 forecasts is less about everyone moving there and more about what it represents: Americans are willing to trade status cities for carefully chosen corners that just fit. Whether it’s in places like South Dakota’s small towns or Knoxville, TN, the next generation of hot destinations will be defined less by state borders and more by places that genuinely feel like home.
Where Will Americans Go in 2026? From Alaska Auroras To Dakota Paychecks
One place with plenty of room for newcomers is our #1 2026 pick, Alaska. Remote workers living out their cabin dreams can catch more auroras and commune with moose, bear, and king crab.
Movers are also forecasted to take advantage of South Dakota’s low unemployment rate, which continues to attract new workers hoping to capitalize on high wages with low costs.
Even West Virginia, which saw its popularity plummet this year, is looking like it could stage a comeback in 2026.
America’s moving story isn’t all about 2025. So while we pulled this year’s move searches, eager to learn who wants to go from where to where in 2025, we couldn’t help but wonder, as the years go by, what do these searches show us about the moves that haven’t even been searched yet, let alone completed?
Forecasting tells us that by the end of next year, we’ll be looking at top in-to-out move ratios in Alaska, Idaho, South Carolina, Maine, and Arkansas. None of these states is forecasted to see fewer than 1.68 new in-moves per exit at any point in 2026, with Alaska hitting nearly 2.5 newcomers per outmove by the end of the year.
| State | Predicted 2026 Ratio | Trend |
| Alaska | 2.45 | Growing interest |
| Idaho | 2.10 | Growing interest |
| South Carolina | 2.09 | Falling interest |
| Maine | 1.78 | Growing interest |
| Arkansas | 1.68 | Growing interest |
| North Carolina | 1.59 | Falling interest |
| Delaware | 1.49 | Growing interest |
| South Dakota | 1.48 | Growing interest |
| Alabama | 1.42 | Falling interest |
| Tennessee | 1.40 | Growing interest |
South Dakota is the state where inbound interest is rising the fastest, followed by Maine and Arkansas.
| State |
Slope of forecasts*
|
| South Dakota | 0.32 |
| Maine | 0.24 |
| Alaska | 0.23 |
*Higher slope means faster projected growth in mover interest from 2019 to 2026.*
Meanwhile, we’ll see the most outflow from California, New Hampshire, New Jersey, Connecticut, and Kansas. None of these least-popular states is forecasted to see positive inflow next year, with these outflow states ranging from .61 to .72 new move-ins per exit across the year.
We’ve already forecasted next year’s most popular cities (Knoxville, TN is #1). Interestingly, none are predicted to be in the nation’s top 5 most-popular states. That split suggests that the next wave of hot destinations isn’t about picking the best state — it will be about picking the right little corner inside states that otherwise fly just under the radar.
Americans Headed North…and South…in 2025
When it comes to moving, 2025 represents a Great Cool-Down and Spread-Out.
While classic retirement destinations are still some of the most popular states and cities in the country, they’re clearly seeing less action.
But the idea of smaller, cooler, and more affordable — with strong lifestyle perks — is here to stay. More Americans are trading big-city prestige for mid-sized metros and even college towns that offer a mix of jobs, decent schools, and outdoor recreation.
Though “return to office” headlines are everywhere, American movers haven’t gotten the memo. They’re still favoring less dense destinations, even taking the idea to the extreme. They’re looking into remote corners of Alaska and retiree suburbs that are a 90-minute drive from the nearest major downtown.
This year, the country’s heartstrings are pulling residents in multiple, but also opposite directions. Some people are chasing snow, though many others are eyeing the white sand beaches of Florida or South Carolina. Others are settling into college towns, Southern suburbs, and exurban havens that haven’t been popular before.
Behind each of those choices is the same shift: lifestyle is winning out when Americans decide where to move.
Previous Years’ Reports:
Methodology
The data used in this report comes directly from moveBuddha’s Moving Cost Calculator.
This analysis takes into account searches made from Jan 1, 2020 through Dec 1, 2025.
For state trends, we only look at state-to-state moves. For cities, we limit the data to places with at least 100 inbound and 100 outbound move searches.
Calculations used in this analysis include:
In-to-Out Ratio In-to-Out = Count of Inbound Moves / Count of Outbound Moves
Ratios >1 indicate more inflow than outflow.
Ratios <1 indicate more outflow than inflow.
The in-to-out ratio is the proportion of inbound vs. outbound moves for a city or state over the course of a calendar year.
Ex: South Carolina in 2023 had a net migration ratio of 2.11 (also expressed as 211) meaning that for every 211 searches for moves in, 100 were searching to move out. In 2024 that ratio decreased to 2.05 (also expressed as 205) meaning that for every 205 inbound move searches, 100 were searching to move out.
Ratio percentage point change: Year-over-year in-to-out ratio percentage point change
Percentage Point Change in Ratio = (In-to-Out Ratio 2025 – In-to-Out Ratio 2024) x 100
Calculations based on year-to-year percentage point change in migration were derived using the state migration ratio. This same method has also been used by LinkedIn data scientists and Bloomberg.
A YoY percent point change >0 indicates that there was an increase in the ratio of inflow from one year to the next.
A YoY percent point change <0 indicates that there was a decrease in the ratio of inflow from one year to the next.
2026 forecast: Our 2026 city forecasts were found using a random forest model.
The model was trained on quarterly data from 2019 to 2025 that accounted for the last four quarters for momentum, the quarter of the year for seasonality, the calendar year for longer-term shifts, and a rolling 12-month average to smooth unusual spikes.
Questions
What are some hidden gem U.S. cities that are starting to get a lot more attention from movers?
Our 2025 data points to a wave of smaller and mid-sized “second ring” cities quietly climbing the charts while big-name metros cool. A few standouts:
- Georgetown, Texas
- Cumming, Georgia
- Fort Collins, Colorado
- Santa Fe, New Mexico
- Asheville, North Carolina
- Bellingham, Washington
Where are people moving in 2026?
Because 2026 hasn’t happened yet, we can’t say for sure where people are moving, but according to our data forecast the top city which will earn the highest ratio of inbound moves is Knoxville, TN and the top state is Alaska.
To surface those predictions, we looked at moveBuddha’s mover search data collected using our Moving Cost Calculator. This provides us insight into the cities rising and falling in interest, so we can provide a math-backed answer to where people may be increasingly moving to and from in 2026.
What actually drives where people are moving right now?
While our data doesn’t pinpoint motivation, the findings point to a simple truth: most people move where they can make the money work. When we look at hundreds of thousands of moving cost searches, the strongest signals line up with jobs and housing costs, not bucket-list dream cities.
Preference still matters, just not for everyone in the same way. Retirees with savings can chase warm weather and golf carts. Remote workers can prioritize mountain towns, coastal suburbs, or “hidden corner” cities with strong lifestyle appeal. Those moves show up in the rise of places like Myrtle Beach, Ocala, Alaska, and a spread of small and mid-sized metros. For the majority of movers, though, the first filter is simple: can I find a job, and can I afford to live there once the moving truck pulls away?

