The Fastest Growing Boomtowns Everyone’s Still Moving to Right Now

Boomtowns come and go. Through the tides, some places like Lakeland (FL) and Austin (TX) have not only captured movers’ interest, but also sustained it.
We combined a decade of Census growth (2014–2024) with mover interest over the past year (2025) to pinpoint the cities turning fast growth into a durable economic engine for long-term prosperity.
What we found:
- 9 of the top 10 metros are in the Census South; Boise City, ID, is the exception.
- The top 10 metros average 26% population growth over the last decade, with the fastest-growth in Lakeland, FL (34.4%).
- The 10 maintain above-average (1.12) move-in ratios, as high as 1.59 in Raleigh, NC.
While moving may be slowing down, those who are choose some places more than others. These are the cities still transforming that virality into real growth.
| Rank | City, ST | 10 Year Pop % Growth | 2025 Move In-to-Out Ratio |
| 1 | Lakeland, FL | 34.39% | 1.33 |
| 2 | Austin, TX | 31.25% | 1.17 |
| 3 | Boise City, ID | 26.85% | 1.41 |
| 4 | Cape Coral, FL | 26.70% | 1.16 |
| 5 | Orlando, FL | 26.67% | 1.25 |
| 6 | Raleigh-Cary, NC | 25.67% | 1.59 |
| 7 | Jacksonville, FL | 24.06% | 1.22 |
| 8 | Deltona, FL | 21.24% | 1.48 |
| 9 | Charlotte, NC | 21.13% | 1.32 |
| 10 | Nashville, TN | 20.04% | 1.32 |
The Top 10 Fastest-Growing Cities Movers Still Love: Florida and the South Lead
Over the past decade, the “silver tsunami” swept retirees to warmer, Southern pastures. Later, soaring insurance premiums washed those retirees back up the coast, depositing many along Carolina shores.
When growth becomes the long-term “norm,” it attracts the next wave with expanding jobs, new construction, and network effects.
That’s easier to achieve in many of our top growth cities, which serve up housing, jobs, and logistics in clustered cities and along convenient corridors, making growth easier to achieve than in single, tight cores common to long-established hubs.
Perhaps that’s why growth is favoring mid-sized metros outside the Northeast. In particular, the South’s dominance is overwhelming: 9 of 10 metros are in the Census South.
As a group, they average 26% growth over 10 years and a ~1.32 in-to-out ratio. With room to expand, the region has become a housing unit growth leader, which, in turn, allows it to absorb more residents.
1. Lakeland, FL

Those heading to Tampa or Orlando once stopped to grab a snack in Lakeland, a waypoint on the I-4 between its larger and more famous siblings. Today, the story is Lakeland itself. It turns out that plenty of “last mile” logistics firms also value the proximity of large urban centers, especially near a college, lakes, Art Deco architecture, and downtown antiques shops. Lakeland’s population growth is our highest overall, up 34.39% since 2014. And it still sees 1.33 new residents move in for every exit, suggesting that its industrial boom isn’t going to go bust.
2. Austin, TX

A rare large hub with sustainable growth, Austin continues to pull 1.17 new movers for every exit, steadily adding to its 31.25% growth rate over the last decade. While its pandemic boom dynamics faded, its net inbound migration remains: the Census continues to flag the Texas startup hub sometimes called “Silicon Hills” as large gaining and fast-growing.
3. Boise City, ID

The only non-southern top spot in the country belongs to Idaho’s outdoorsy capital, which ramped up its economic appeal as a tech ecosystem fueled by semiconductor and printer employers back in the 80s. Once it offered a small metro with real careers and talent development, the flywheel kicked in. Over the past 10 years, this “mini Austin” has grown 26.85% and keeps turning heads with a 1.41 in-to-out ratio.
4. Cape Coral, FL
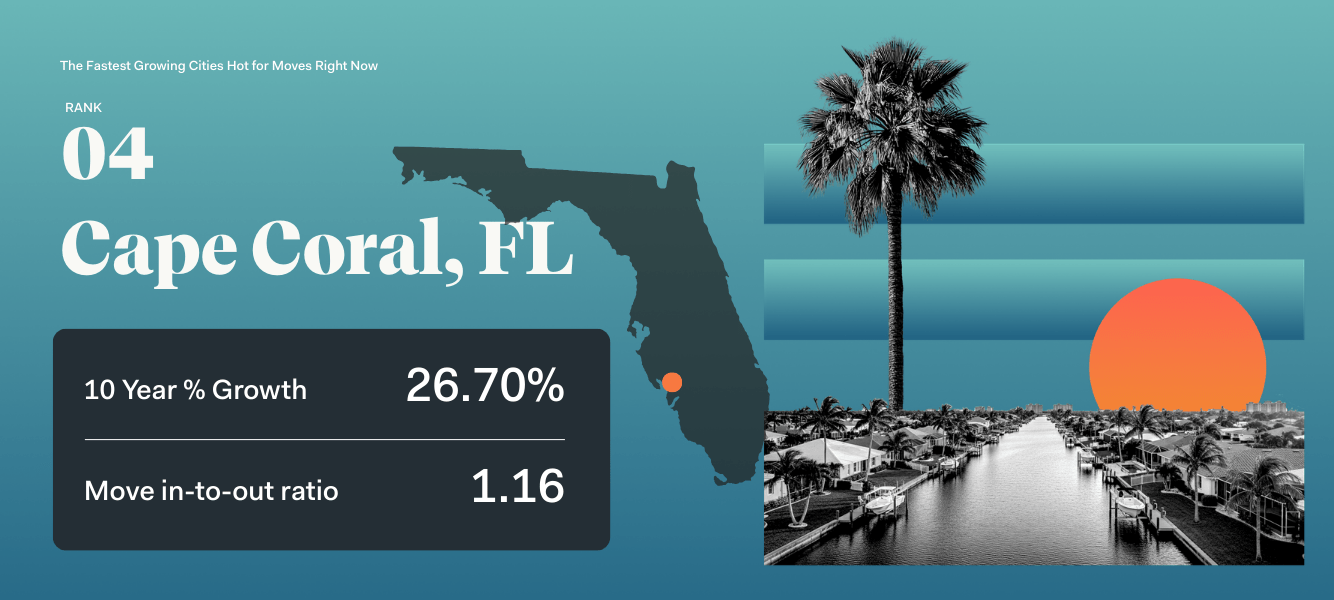
This post-war development of single-family canalside homes has become a metro of its own, sustaining its long-running inflow, up 26.70% in the last 10 years. With the top 10’s lowest current in-to-out ratio (1.16), Cape Coral’s seaside star may be dimming, but as a retirement haven, with a stable pipeline of second homes and replenishing demand, its steady influx shouldn’t burn out anytime soon.
5. Orlando, FL
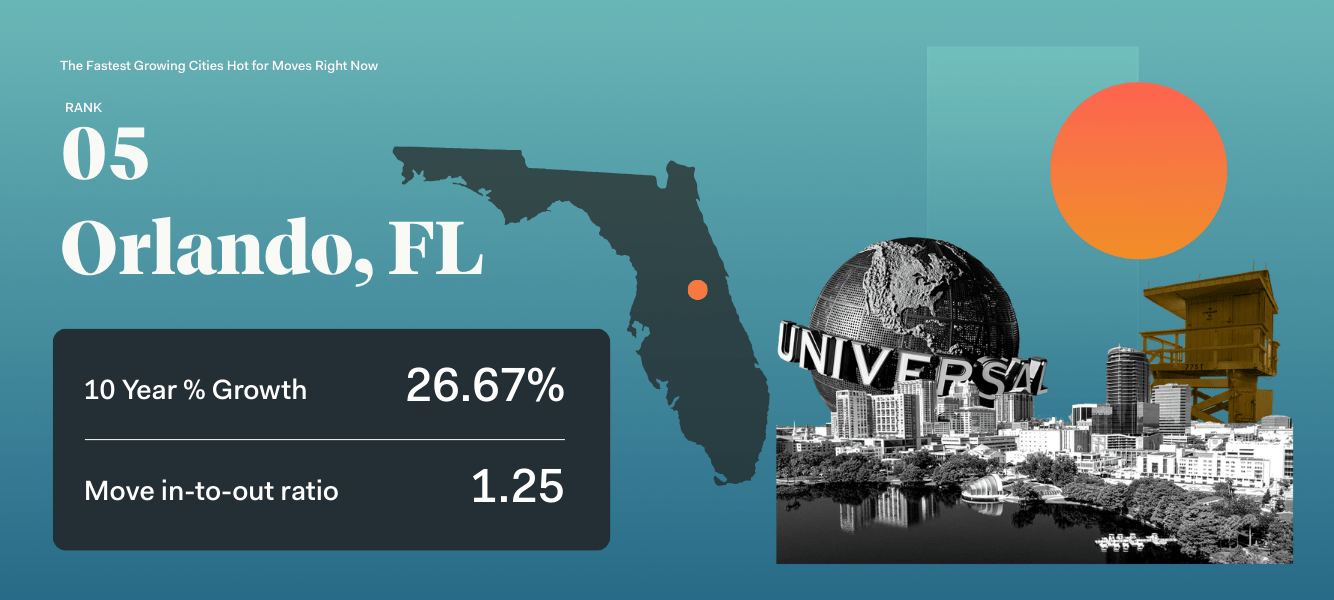
It’s a challenge to disentangle Orlando’s growth story from that of Disney World, which brought large-scale tourism and a massive service economy, then catalyzed decades of hotel and infrastructure buildout. Today, 1.25 newcomers move in for every exit, adding to the past decade’s already magical 26.67% population growth. Tomorrow promises growth via connection to #1 Lakeland’s logistics and distribution power, and an expanding cluster of talent, jobs, and new homes that grease the flywheel of a diverse economic engine, creating staying power beyond the lifespan of a single mouse.
6. Raleigh-Cary, NC

Raleigh’s rally continues. In fact, it’s 2025 move ratio is 1.59, the highest in the top 10, with 1.59 moves inbound for every resident that leaves. Like #5 Orlando and #1 Lakeland, the cluster effect of North Carolina’s Research Triangle has meant less influx friction: the 30,000+ new residents might find medical resources in Chapel Hill or Durham, high-rise offices on Raleigh, and new homes in Cary.
7. Jacksonville, FL
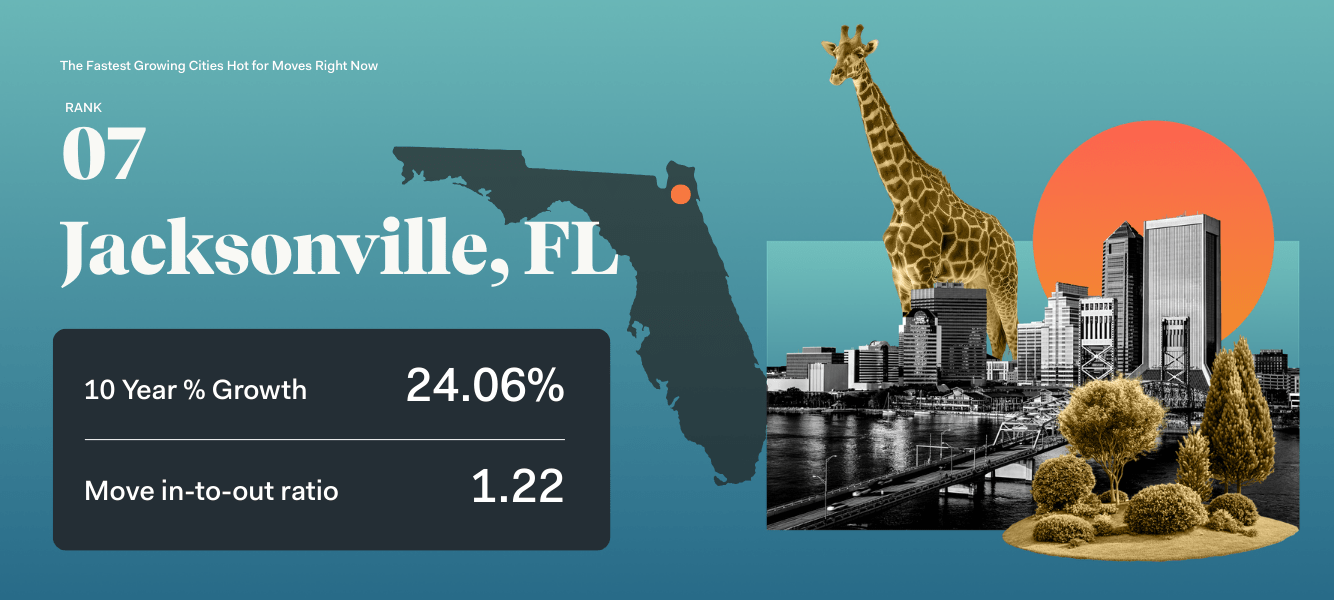
The pandemic Florida craze sent a lot of newcomers to metros all over the Sunshine State. With lower housing costs than either Orlando or Miami, Jacksonville grabbed a slice of that in-migration, adding more than 24% to its population from 2014 to 2024. Though move interest is down, with a current 1.22 in-move ratio, Florida’s largest city is stabilized by the Port of Jacksonville and decades-long defense-industry opportunities, making it a prime locale for sustainable growth even as its trendiness fades.
8. Deltona, FL

Up more than 21% since 2014, Deltona’s growth started with planned communities in the 1960s. Today, with an in-to-out ratio of 1.48, it’s still a housing supply machine for in-migration, capitalizing on commuters heading into Deltona, with retirees favoring out on the beaches. As another “practical” location with affordable housing and amenities within striking distance, the metro continues to find itself on the radar of movers in 2026.
9. Charlotte, NC

According to the U.S. Census, Charlotte is still pulling in more than 61,000 new residents per year, even after a decade-long marathon growth spurt (ranking 11th in the country). Even today, Charlotte sees 1.32 in-move inquiries for every resident seeking to leave Queen City. It all goes to show that there’s no chance in 2026 that this reigning banking hub is surrendering its crown.
10. Nashville, TN

As a cultural name brand and a healthcare heavyweight, Nashville has built up a diverse economic infrastructure that charms newcomers, from upstart songwriters to tech giants — and allows job changers to stay in town, too. As a result, Nashville’s seen its population expand from ~179K to over 215K residents since 2014, a jump of more than 20%. And with a 1.32 move ratio today, Music City is still rocking that inbound demand.
Building Demand is About Building
#6 Raleigh, #8 Deltona, and #3 Boise are not only in the top 10 growth cities over the last decade; they’re current top-10s across the nations 100 largest metros today, proving that different types of locations can sustain growth when the fad’s over. From beachside retirements to university zones to foothills trailheads, sustaining long-term growth isn’t about type.
America’s love affair with these long-term performers isn’t about looks, but it is about being able to take on newcomers without crumbling under congestion, unaffordable housing, and a nostalgic longing for the small-town old days.
In the end, the metros that are winning today aren’t more desirable than other American cities in and of themselves. They’re just the cities that manage to build for the future without forgetting how good they looked in the past.
Methodology
We looked at U.S. cities with the highest population growth, in percentage, over the past 10 years (2014-2024), considering only cities with above-average move-in ratios to highlight move interest right now.
The cities are ranked by those with the fastest-growth across the past decade’s worth of data.
Not what you were looking for?
Check out other categories that can help you find the information you need!

