Starter Home Hotspots: These Metros Are Best for First-Time Buyers in 2026

The American “starter home” is slipping out of reach, except in the South and Midwest, where the dream remains mostly intact. These modest boxes on hillsides once supported young families waiting for the next baby to launch them into bigger and better things. They represented not only adulthood and stability, but the promise of a lifetime of building equity.
Today, first-time buyer share is at a record low, with 21% of home purchases made by first-timers. Historically, first-time buyers have comprised up to 40% of home buys. Further, buyers are older than ever, with a median age of 40, up from a median age of 28 in 1991.
In 2025, 20- and 30-somethings were missing out more than their parents or grandparents, with long-term consequences.
We wanted to know where a starter home was most attainable.
So we created the Starter Home Index.
It’s not only about where no-frills housing has high availability, but also where it’s affordable and where the quality of life is high, encompassing factors such as safety, cost of living, and unemployment rates.
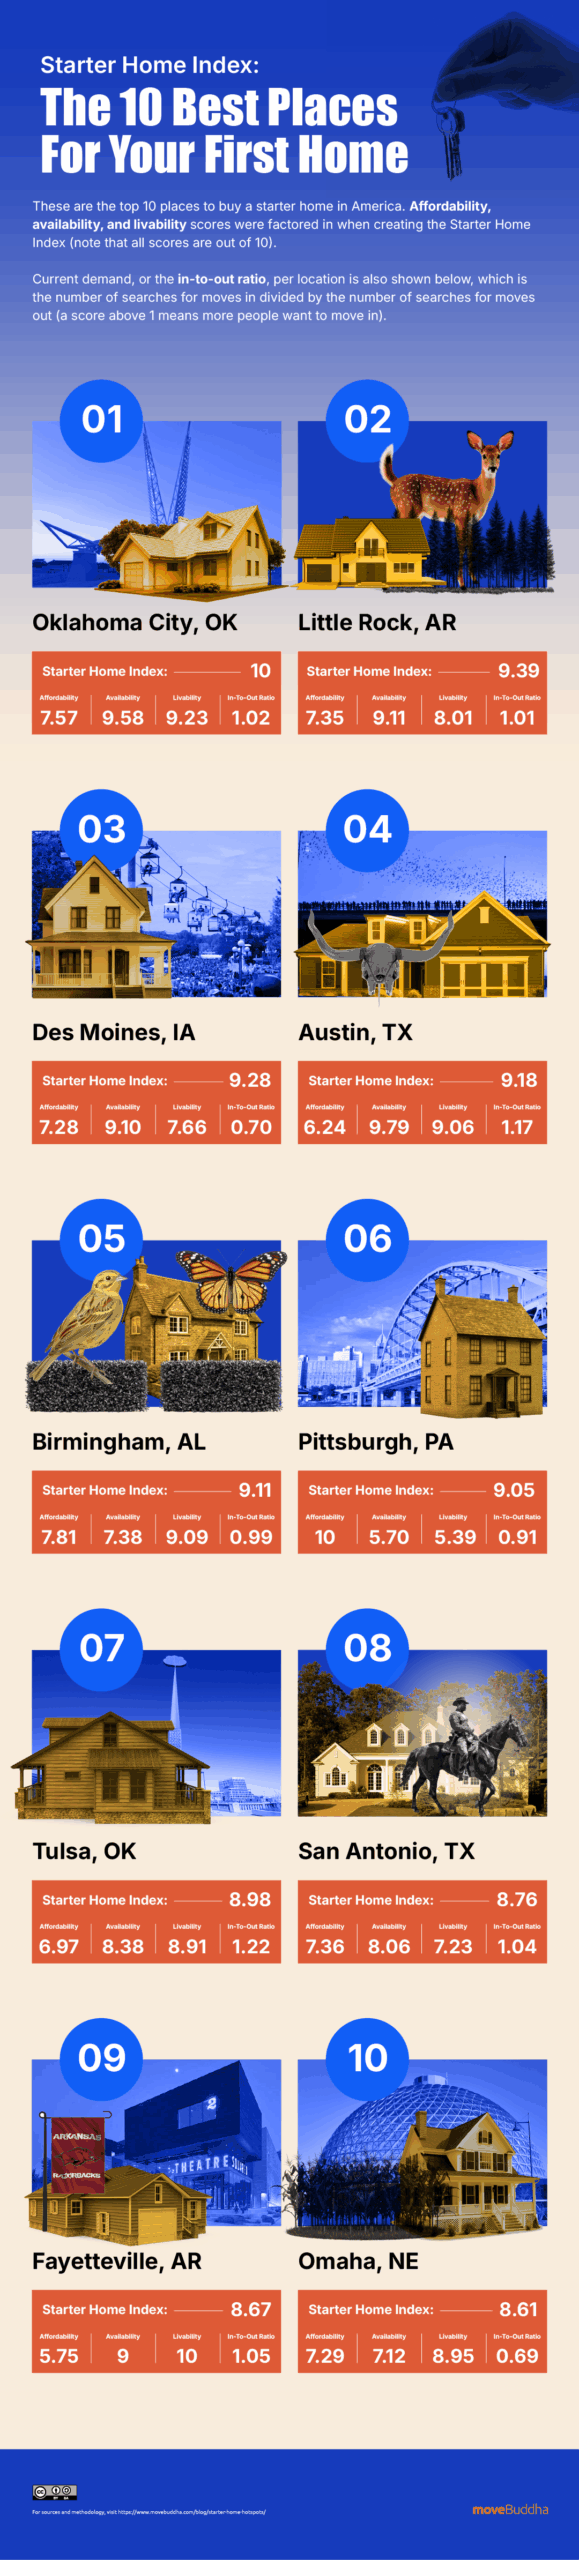
We found that today, new buyers should look to Oklahoma City, OK, to grab a spot on the property ladder that balances affordability with availability and livability. But among starter home standouts, Nashville, TN, was where Americans wanted to move most in 2025.
Key Takeaways
- #1 Oklahoma City is the top city for starter home buyers in the U.S., with high scores across the three core categories: affordability, availability, and livability. #2 Little Rock, #3 Des Moines, #4 Austin, and #5 Birmingham round out the top five.
- The South leads overall, carrying 7 of the top 10 spots.
- The Midwest is tops for first-timers in affordability. While 6 metros land in the top 25 overall, Midwest metros make up 11 of the top 25 in the affordability category.
- That includes Pittsburgh, the #1 most affordable of the top 25.
- Where’s the hottest move to spot where starter homes are still in style? It’s Nashville, TN, with the highest ratio of in-moves compared to out in the top 25.
- First-time friendliness leads to popularity. 10 of the top 25 starter home hotspots are also hot move-to destinations.
Top Cities for First-Time Buyers
The first thing first-timers need to know is: go east (but not to the Northeast). Twenty-four of the top 25 starter home cities lie east of the 100th meridian, an irrigation line that roughly separates the humid east from the arid plains.
But there are divides within this cluster of eastern stater home destinations: the South leads overall, with top scores in availability and move demand.
The U.S. Census South represents just 32% of the nation (16 states, including OK, AR, TX, and AL). But the region claims 70% of the top 10 ranking cities for buying a starter home. That’s about 2.2 times what one might expect if starter homes were distributed equally across the country.
Meanwhile, the Midwest’s starter home power is supported by affordability. With 4 cities in the top ten for under-35 homeownership, the region is succeeding at getting young adults onto the property ladder, though they bring different strengths to the table. For example, cities like Toledo and Des Moines land in the top 20 American cities for cost of living, while Omaha and Indianapolis rank for low unemployment.
#1 Oklahoma City, OK
Oklahoma City leads in availability and livability; it’s #3 in both categories, with affordability close behind at #6. OKC residents can shop around with 78% of homes in the 1-3 bedroom range, joining 54% of homeowners under 35. And with 532 available homes per 100K residents, they’ll surely find something cool to invest just 20.4% of their income on. That makes it one of the wallet-friendliest cities in America, since mortgage burden in America today ranges from roughly 18 to 60 percent of monthly income.
#2 Little Rock, AR
Arkansas’ capital makes the top ten with its #6 availability score and with strong affordability. Here, newcomers will find 515.12 for-sale listings per 100K residents (almost 25% above the average), while paying just 20.5% of their monthly income, almost 11 points less than what most Americans face. With low mortgage and cost of living burdens, buyers can settle into their very first home with less stress.
#3 Des Moines, IA
Iowa’s capital offers 495.9 listings per 100,000 residents, ranking it #7 in availability. In this city at the confluence of the Des Moines and Raccoon rivers, buyers get real choices: 72.3% of homes are in the 1-3 bedroom range. And that’s meant that fellow neighbors who are first-timers are plentiful, too — Des Moines sees 60% of its under-35 residents own their own homes (that’s #5 nationally).
#4 Austin, TX
With a whopping 645.7 listings per 100K residents (powering its #2 availability rank) and a top-5 livability score, Austin is a destination where entry buyers can actually find something from among the 71% of housing stock that consists of 1-3 bedroom homes. Once they get to Hill Country, they can try to snag one of the highest average incomes of any of the top 25, which makes this young, growing city all the more attractive. Maybe that’s why it has the highest percentage of 25-35-year-old residents in the field, at over 17%.
#5 Birmingham, AL
While Birmingham’s incomes are about 16% less than the average across cities, local mortgage payments as a share of income, plus starter home prices as a multiplier of annual income, are both 24% and 31% lower, respectively, so residents come out ahead. And with one of the country’s best unemployment rates (tied for #1 at 2.5%), first-timers stand a good chance of being able to pay for their new home in the future in this booming economy.
#6 Pittsburgh, PA
The Burgh relies on its unparalleled affordability to secure a top ten spot (while #1 in affordability, the city comes in #63 in availability and #53 in livability). The trade-off? A starter home in Pittsburgh will eat up fewer years of your income than any other American city (3.05) and cost newcomers the lowest percentage of income each month (18.21%). And with a below-average cost of living and wages just 1.9% lower than the average, new homeowners can spend their hard-earned cash on local splurges, like opting for the best snowblower money can buy. They’ll still come out ahead.
#7 Tulsa, OK
Joining Oklahoma City in the top ten, this Sooner State city shines in housing availability, which opens up options for first-time buyers. Its 471 listings per 100K residents is almost 14% higher than the national average, so buyers are spoiled for choice. And they’ll likely be able to afford the home they pick out: Tulsa ranks #3 in the country in cost of living. Its #8 livability index isn’t just fueled by low local price tags. Tulsa is also attractive to young workers with the 10th lowest unemployment (3.4%) of all cities.
#8 San Antonio, TX
With 559 listings per 100K residents, Texas once again proves its “bigger-here” construction industry is working to meet the needs of starter home buyers. Availability is San Antonio’s strong suit, but its balance of affordability factors shows that you’ll be able to pay for more of those options, too. Once you make up your mind, you’ll pay about 3.29X the average annual income to get onto the property ladder. That low multiplier means that only 22.4% of your monthly check will go to that mortgage, about 9 points lower than the norm.
#9 Fayetteville, AR
Sure, it’s #51 in affordability, but while its real estate market might take a chunk out of first-timers’ savings, its #9 availability index with #1 livability will charm them. The charming university town comes with a stable economy that’s #12 among all cities in unemployment. Its cost of living is low. And as graduates stay to enjoy the town they’ve grown to love. And in spite of a middling affordability score, the average mortgage payment here, as well as starter home price tags, are less than normal.
#10 Omaha, NE
The prairie city’s highest showing in livability reflects low unemployment (3.2%), a lower-than-average cost of living, and an average safety rating. It all meshes to create a stable, affordable quality of life for young homebuyers, where the average mortgage will set them back just $1,485. And fun fact: bargain real estate doesn’t mean low-ball salaries: the median household income here is 3.2% above the average of all our cities.
Nashville, TN, was the Starter Home Hotspot Everyone Wanted to Move to in 2025
With 1.31 newcomers for every person moving away, Music City is the most popular destination that’s also a starter home Mecca. It comes in #14 overall, proving that while it’s hard for new buyers to break into desirable locations, it’s not impossible.
Where else can starter home buyers get in on hot markets? Of the top 25 starter-home-friendly cities, here are the 10 with positive in-move interest.
Counterintuitively, move popularity can benefit first-time buyers.
While increased demand might seem like bad news for affordability (Ex: Austin), popular migration destinations often create conditions that help first-time buyers. First, high in-migration signals developer confidence. Builders are more likely to break ground on new construction, offsetting cost pressures. The circulation of properties can create a fresh real estate landscape with a steady stream of available properties.
Eventually, though, cities struggle to maintain all three factors at once. Investors can chase migration trends, pricing out buyers. Livability comes with extra costs, like maintaining low crime. That erodes affordability. And a cycle of gentrification sets in: young buyers attract businesses, improvement, and investment, all of which push out the next generation of newcomers.
For now, these ten cities are balancing all the factors that first-time buyers — and other newcomers — want.
First-Time Buyers Can Still Win
Overall, winners must work to manage affordability, availability, and livability. Cities like Oklahoma City and Little Rock are balancing all three better than most other American cities: they offer a high number of listings, low payment-to-income mortgages, and a reasonable cost of living.
That’s a combination that can be rare, even in other top cities for starter-home buyers, which struggle to find the perfect recipe. Take Nashville: it’s #4 in availability but #72 in affordability, with lots to choose from (just not for entry-level buyers). And in Pittsburgh, #1 affordability pairs with #63 availability, so it’s cheap to own — if you can find something.
Hitting the 3-part combo (affordability, availability, and livability) can be tough, but to win starter-home buyers, cities will have to pull all 2 of these levers.
How long will they keep it up? We can’t say. But for now, these cities are doing the best at offering first-time buyers their place on the property ladder.
Questions
Where is the best city to afford a starter home?
That’s Oklahoma City, where affordability (ranked #6), availability (ranked #3), and livability (ranked #3), balance to favor young buyers. It’s also the only city that scored in the top ten in all 3 categories.
Which city is the most affordable for first-time buyers?
With an average household income of $73,942, and an average 3-bedroom home price of $225,432, starter home buyers in Pittsburgh can spend a sliver over 3 times their annual income to secure their first home, handing over a monthly mortgage payment of $1,122. These buyers will own their home and keep more than 80% of their monthly income in their pockets.
Which city is the least affordable for first-time buyers?
The least affordable city in America for starter home buyers is Los Angeles. Angelenos earn around $93,525 yearly, but they’ll need to spend over $900K on an average 3-bedroom home. That’s 9.77 years’ worth of paychecks. When they get the keys, Angelenos will fork over $4,707 each month to pay for it (60.4% of their incomes).
Which city has the highest availability for first-time buyers?
Though it finishes out of the top 10 overall, the Cape Coral/Fort Myers metro can still brag that it has the highest starter home availability in the country. Though the city boasts 84.7% of homes in the 1-3 bedroom range (#2 with nearby Sarasota taking the top prize), Cape Coral sees just 22% of its residents under 35 buying their own homes. Yet with a whopping 1,654 starter homes available per 100K residents, availability is almost 3X other top cities.
Methodology
We examined Americas 100 largest metros across three categories we deemed essential to uncover the places best for buying starter homes in America:
-
- Affordability (50%): The home price to income ratio (median area household income divided by home price) and mortgage rates as a share of average monthly income
- Availability (25%): The % of small-ish homes (1-3 bedrooms), proportion of under-35 homeownership, and high for-sale inventory per capita
- Livability (25%): Cost of living, the percentage of 25-35-year-olds, unemployment, and safety
We added in moveBuddha moving search data to understand which of the starter home hotspots are hot for Americans moving, too.
Moving Demand (0%): Where more movers are looking to move in than out, suggesting population and economic growth as well as social appeal.
While we didn’t score “demand,” first-time buyers get a boost from economically strong destinations that are attracting not just first-timers, but newcomers at all levels of their careers and financial journeys. The addition of inflow data helps identify not just where new buyers can get into a home, but where they can secure their futures by being part of a growing community and economy.
Data:
| City | Final Rank | Starter Home Hotspot Score | Affordabiltiy Final Score (50%) | Avaliability Final Score (35%) | Livability Final Score (15%) | In-to-Out Move Ratio (0%) |
| Oklahoma City, OK | 1 | 10 | 7.57 | 9.58 | 9.23 | 1.02 |
| Little Rock, AR | 2 | 9.39 | 7.35 | 9.11 | 8.01 | 1.01 |
| Des Moines, IA | 3 | 9.28 | 7.28 | 9.10 | 7.66 | 0.70 |
| Austin, TX | 4 | 9.18 | 6.24 | 9.79 | 9.06 | 1.17 |
| Birmingham, AL | 5 | 9.11 | 7.81 | 7.38 | 9.09 | 0.99 |
| Pittsburgh, PA | 6 | 9.05 | 10 | 5.70 | 5.39 | 0.91 |
| Tulsa, OK | 7 | 8.98 | 6.97 | 8.38 | 8.91 | 1.22 |
| San Antonio, TX | 8 | 8.76 | 7.36 | 8.06 | 7.23 | 1.04 |
| Fayetteville, AR | 9 | 8.67 | 5.75 | 9.00 | 10 | 1.05 |
| Omaha, NE | 10 | 8.61 | 7.29 | 7.12 | 8.95 | 0.69 |
| Wichita, KS | 11 | 8.54 | 8.27 | 6.30 | 7.21 | 0.77 |
| Indianapolis, IN | 12 | 8.53 | 6.99 | 7.82 | 7.86 | 0.84 |
| Baton Rouge, LA | 13 | 8.42 | 6.95 | 8.08 | 6.86 | 0.70 |
| Toledo, OH | 14 | 8.24 | 8.33 | 6.56 | 4.90 | 0.97 |
| McAllen, TX | 15 | 8.19 | 6.78 | 8.28 | 5.82 | 1.12 |
| New Orleans, LA | 16 | 8.12 | 6.34 | 8.32 | 6.79 | 0.84 |
| Nashville, TN | 17 | 8.01 | 4.79 | 9.37 | 9.02 | 1.31 |
| Houston, TX | 18 | 8.01 | 7.42 | 7.45 | 4.71 | 0.98 |
| El Paso, TX | 19 | 8.01 | 6.54 | 7.22 | 8.17 | 0.80 |
| Jackson, MS | 20 | 7.77 | 7.19 | 6.34 | 6.85 | 0.84 |
| Dallas, TX | 21 | 7.72 | 6.78 | 7.58 | 5.07 | 1.12 |
| Memphis, TN | 22 | 7.71 | 7.52 | 6.07 | 6.07 | 0.61 |
| Louisville, KY | 23 | 7.60 | 6.40 | 7.10 | 6.90 | 0.92 |
| Kansas City, MO | 24 | 7.57 | 7.05 | 6.09 | 6.88 | 0.93 |
| Jacksonville, FL | 25 | 7.53 | 5.95 | 8.36 | 5.08 | 1.25 |
| Columbia, SC | 26 | 7.53 | 6.84 | 6.67 | 6.04 | 1.26 |
| Detroit, MI | 27 | 7.51 | 7.00 | 6.86 | 4.99 | 0.90 |
| Columbus, OH | 28 | 7.44 | 6.21 | 6.92 | 7.10 | 0.80 |
| Raleigh, NC | 29 | 7.41 | 6.27 | 6.67 | 7.34 | 1.60 |
| Akron, OH | 30 | 7.38 | 8.01 | 5.25 | 4.75 | 0.74 |
| Charleston, SC | 31 | 7.35 | 4.89 | 9.00 | 6.22 | 1.28 |
| Chattanooga, TN | 32 | 7.20 | 5.17 | 7.48 | 8.11 | 1.69 |
| Atlanta, GA | 33 | 7.11 | 6.39 | 6.26 | 6.44 | 1.01 |
| Greenville, SC | 34 | 7.10 | 5.55 | 7.49 | 6.30 | 1.99 |
| St. Louis, MO | 35 | 7.09 | 7.01 | 6.08 | 4.63 | 0.96 |
| Charlotte, NC | 36 | 7.06 | 5.49 | 7.43 | 6.43 | 1.34 |
| Augusta, GA | 37 | 7.06 | 7.11 | 5.65 | 5.15 | 1.32 |
| Virginia Beach, VA | 38 | 7.05 | 5.97 | 6.30 | 7.42 | 0.87 |
| Cincinnati, OH | 39 | 7.03 | 6.84 | 5.77 | 5.66 | 0.89 |
| Cape Coral, FL | 40 | 7.02 | 4.99 | 10 | 1.87 | 1.13 |
| Knoxville, TN | 41 | 7.01 | 4.64 | 7.83 | 8.07 | 1.74 |
| Colorado Springs, CO | 42 | 6.96 | 5.05 | 6.95 | 8.53 | 1.12 |
| Cleveland, OH | 43 | 6.95 | 7.43 | 4.46 | 6.37 | 0.95 |
| Winston, NC | 44 | 6.86 | 5.80 | 6.55 | 6.41 | 0.63 |
| Madison, WI | 45 | 6.84 | 4.97 | 6.29 | 9.69 | 0.95 |
| Lakeland, FL | 46 | 6.79 | 5.30 | 8.09 | 4.15 | 1.28 |
| Durham, NC | 47 | 6.74 | 4.94 | 7.06 | 7.53 | 1.04 |
| Denver, CO | 48 | 6.68 | 4.48 | 7.69 | 7.30 | 1.02 |
| Minneapolis, MN | 49 | 6.60 | 6.57 | 5.65 | 4.68 | 1.28 |
| Greensboro, NC | 50 | 6.59 | 5.89 | 6.05 | 5.94 | 1.41 |
| Scranton, PA | 51 | 6.47 | 6.97 | 4.97 | 4.30 | 1.36 |
| Boise City, ID | 52 | 6.44 | 4.40 | 6.80 | 8.42 | 1.55 |
| Harrisburg, PA | 53 | 6.43 | 6.73 | 4.83 | 5.21 | 1.03 |
| Milwaukee, WI | 54 | 6.39 | 5.33 | 6.26 | 6.32 | 0.82 |
| Syracuse, NY | 55 | 6.38 | 7.49 | 3.49 | 5.53 | 0.76 |
| Grand Rapids, MI | 56 | 6.37 | 5.89 | 5.42 | 6.31 | 1.35 |
| Deltona, FL | 57 | 6.34 | 4.96 | 9.19 | 0.49 | 1.52 |
| Orlando, FL | 58 | 6.32 | 5.08 | 6.73 | 5.70 | 1.25 |
| Tampa, FL | 59 | 6.26 | 4.75 | 7.82 | 3.97 | 0.93 |
| Buffalo, NY | 60 | 6.18 | 6.40 | 4.27 | 6.35 | 0.84 |
| Rochester, NY | 61 | 6.14 | 7.09 | 3.68 | 5.23 | 0.86 |
| Chicago, IL | 62 | 6.11 | 6.61 | 4.79 | 4.08 | 1.05 |
| Palm Bay, FL | 63 | 6.10 | 5.63 | 6.74 | 2.76 | 1.33 |
| Albuquerque, NM | 64 | 6.04 | 4.85 | 6.19 | 6.29 | 0.86 |
| Portland, ME | 65 | 6.00 | 3.90 | 7.06 | 7.28 | 2.58 |
| Albany, NY | 66 | 5.90 | 6.12 | 4.26 | 5.91 | 0.87 |
| Baltimore, MD | 67 | 5.87 | 6.45 | 4.57 | 3.93 | 0.73 |
| Las Vegas, NV | 68 | 5.81 | 4.27 | 7.17 | 4.83 | 0.98 |
| Richmond, VA | 69 | 5.79 | 5.99 | 3.74 | 7.00 | 1.08 |
| Provo, UT | 70 | 5.76 | 4.85 | 4.64 | 8.52 | 0.91 |
| Bakersfield, CA | 71 | 5.58 | 4.78 | 7.41 | 1.44 | 0.51 |
| Phoenix, AZ | 72 | 5.55 | 4.79 | 5.96 | 4.61 | 0.96 |
| New Haven, CT | 73 | 5.53 | 5.30 | 5.23 | 4.51 | 0.82 |
| North Port, FL | 74 | 5.53 | 4.49 | 8.08 | 0.52 | 1.11 |
| Tucson, AZ | 75 | 5.50 | 4.85 | 5.51 | 5.17 | 1.08 |
| Spokane, WA | 76 | 5.45 | 4.20 | 6.28 | 5.34 | 1.14 |
| Philadelphia, PA | 77 | 5.43 | 6.47 | 4.07 | 2.80 | 1.00 |
| Portland, OR | 78 | 5.40 | 4.39 | 6.68 | 3.55 | 1.27 |
| Salt Lake City, UT | 79 | 5.40 | 4.43 | 4.37 | 8.80 | 0.88 |
| Worcester, MA | 80 | 5.35 | 4.88 | 6.03 | 3.17 | 0.80 |
| Ogden, UT | 81 | 5.27 | 5.18 | 3.41 | 7.87 | 1.02 |
| Miami, FL | 82 | 5.17 | 3.35 | 7.98 | 2.81 | 0.86 |
| Hartford, CT | 83 | 5.04 | 5.84 | 3.71 | 3.81 | 0.75 |
| Allentown, PA | 84 | 5.03 | 6.06 | 3.61 | 3.26 | 0.81 |
| Seattle, WA | 85 | 4.89 | 3.81 | 6.02 | 4.41 | 0.96 |
| Providence, RI | 86 | 4.70 | 4.04 | 5.42 | 4.12 | 0.84 |
| Washington, DC | 87 | 4.40 | 5.65 | 2.80 | 3.33 | 0.72 |
| Boston, MA | 88 | 3.80 | 3.84 | 4.06 | 3.42 | 0.89 |
| Sacramento, CA | 89 | 3.77 | 4.24 | 4.06 | 1.98 | 0.87 |
| Fresno, CA | 90 | 3.70 | 4.46 | 3.89 | 1.29 | 0.65 |
| Riverside, CA | 91 | 3.46 | 3.67 | 4.28 | 1.81 | 0.65 |
| Stockton, CA | 92 | 2.97 | 4.36 | 3.00 | 0.00 | 0.70 |
| Urban Honolulu, HI | 93 | 2.95 | 2.53 | 2.72 | 6.66 | |
| New York, NY | 94 | 2.72 | 3.30 | 3.20 | 1.84 | 0.78 |
| San Diego, CA | 95 | 2.66 | 2.51 | 3.38 | 3.72 | 0.62 |
| Bridgeport, CT | 96 | 2.64 | 4.42 | 1.07 | 2.63 | 0.63 |
| San Francisco, CA | 97 | 1.60 | 2.76 | 1.53 | 1.87 | 0.78 |
| Oxnard, CA | 98 | 0.88 | 2.99 | 0.16 | 0.71 | 0.55 |
| San Jose, CA | 99 | 0.70 | 2.00 | 0.00 | 3.52 | 0.82 |
| Los Angeles, CA | 100 | 0.00 | 0.00 | 2.30 | 1.29 | 0.75 |
Not what you were looking for?
Check out other categories that can help you find the information you need!

