These 25 Cities Need Your Help Feeding the Hungry this Holiday Season
Fight food insecurity by donating or volunteering in one of these cities in need.
The holiday season in America is a time to give to those less fortunate than us and display a spirit of generosity. But while many celebrate the holidays with multiple celebratory feasts, as many as 42 million people across the country are living in food-insecure conditions.
This giving season, we wanted to find out which communities in America offer the most opportunities (and have the greatest need) for locals interested in giving back in the fight against hunger. For America’s 200 most populous cities, we analyzed a broad range of data related to food insecurity, homelessness, poverty, budget shortfalls, local pantry programs, and more, to find 25 communities where donations and volunteers can go a long way to helping put food on the table of families in need.
Findings at a glance
- Albuquerque, NM is the city with the most opportunities matched with a relatively high need for donations and volunteers in the fight against hunger. 15% of households in New Mexico’s largest city receive SNAP benefits, and with 159 food pantries and soup kitchens throughout the city, there are many chances to get involved this holiday season.
- Los Angeles and New York City are the two cities with the largest annual food budget shortfalls. Food-insecure residents in these cities would require an additional $251 million and $213 million, respectively, to meet their food requirements. By comparison, the average budget shortfall among America’s 200 most populous cities is $24.4 million.
- Philadelphia is the city with the greatest number of missed meals. Food-insecure residents in Philly miss a total of 38.8 million meals per year, or the equivalent of skipping dinner every other day.
The State of Food Insecurity in America
Food insecurity is a phenomenon defined by a lack of reliable access to sufficient quantities of affordable, nutritious food. A major issue in the United States, Feeding America projects that 1 in 8 people and, worse still, 1 in 6 children will have experienced food insecurity during 2021.
Levels of food insecurity co-occur with factors such as housing insecurity, unemployment, and poverty, and research has found that food insecurity is associated with an array of negative health outcomes such as increased risk of birth defects, anemia, cognitive problems, aggression, anxiety, and more.
Furthermore, rates of food insecurity in America show significant racial disparities: latino households are nearly 2x more likely to be food-insecure than white households, black households nearly 2.5x more likely, and Native American households nearly 4x more likely.
25 cities that need your help to fight food insecurity
Food insecurity is widespread across America, and just because there are fewer food-insecure families in one region does not mean those families are any less deserving of help than those living in another region.
While our analysis uses comparative metrics to demonstrate the magnitude of community-wide need, it is not meant as an appeal to donate or volunteer in any one region over another. Rather, we hope this analysis can serve as a call-to-action for anyone with means to look further into the issue of food insecurity within their own community and to get involved how and where they can.
Here are 25 cities in America with the greatest need and most opportunities to give back this holiday season:
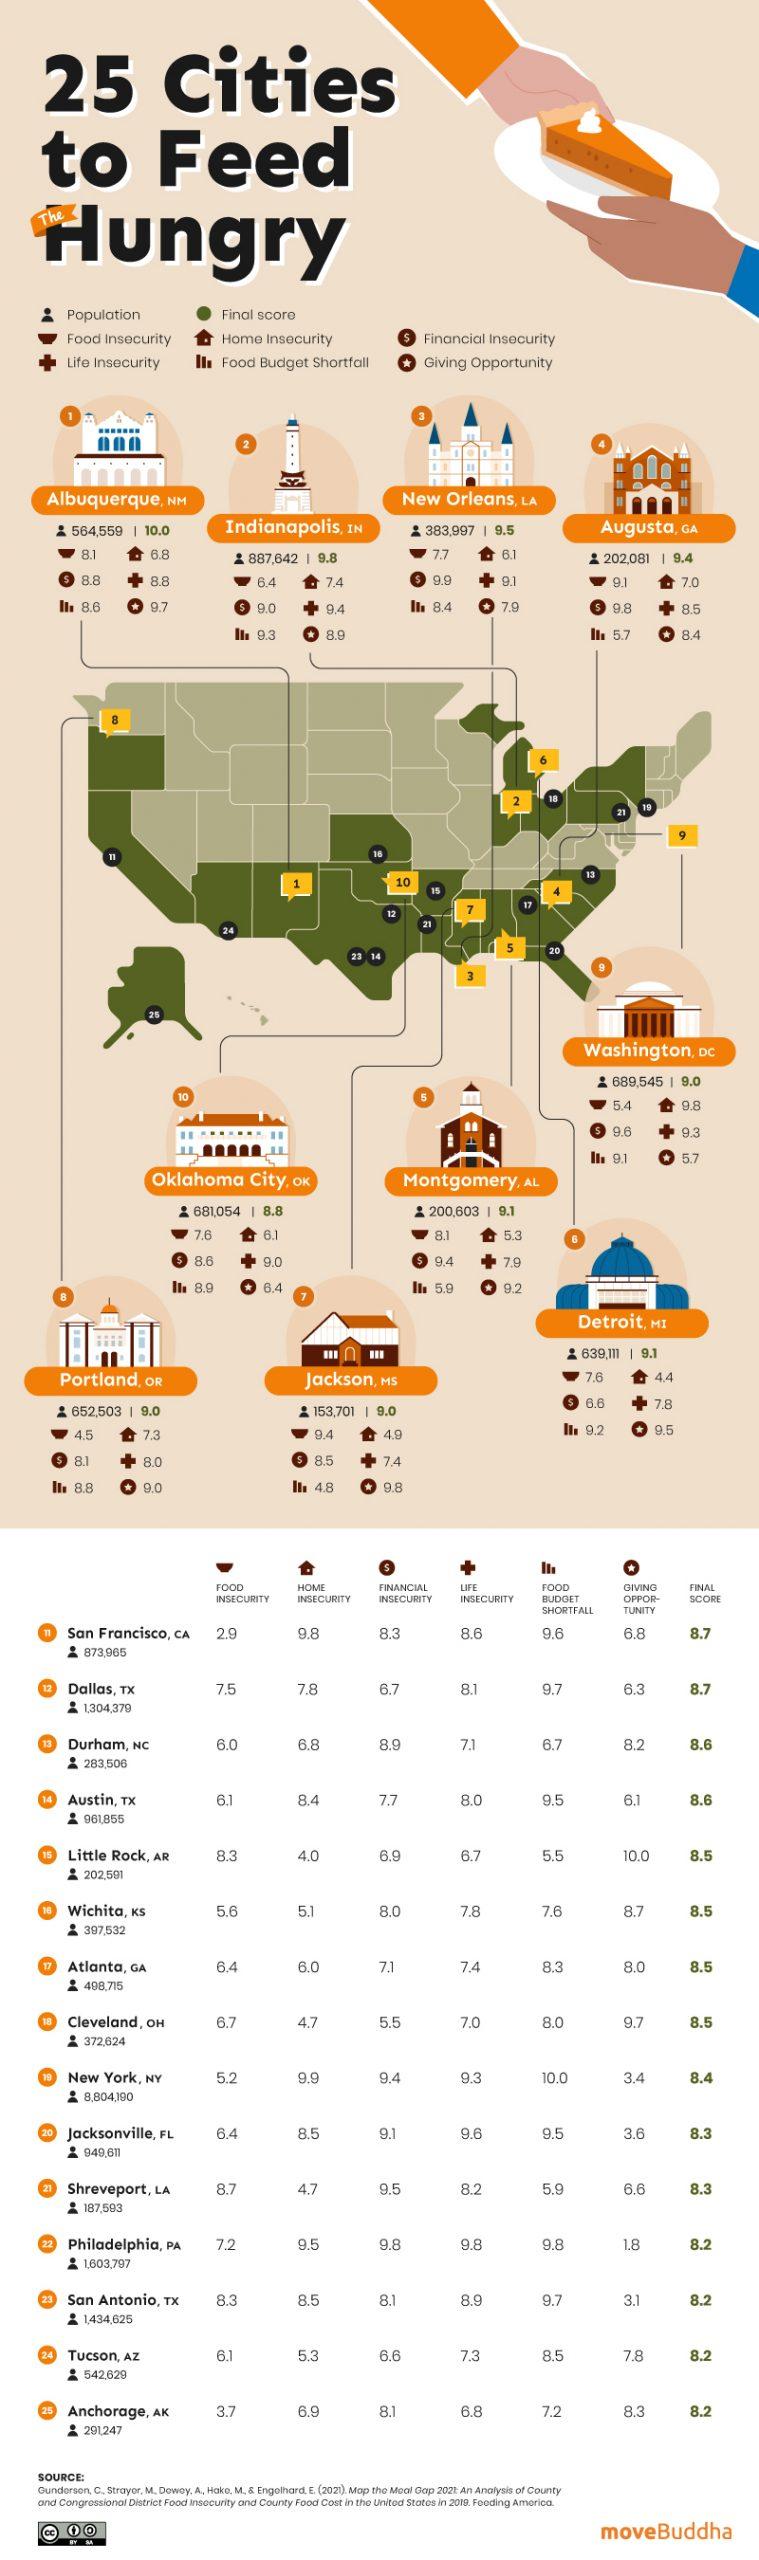
Albuquerque, NM is the city with a comparatively high magnitude of need matched with many opportunities for involvement in the fight against food insecurity. In Albuquerque, nearly 15% of households receive SNAP benefits and 72% of students are eligible for free or reduced school lunches (compared to an average of 10% and 54% among America’s 200 largest cities). Even with this assistance, Feeding America reports that some 12.8% of Albuquerque residents are food-insecure, and that an additional $48.6 million dollars annually would be necessary to ensure each of these people get three balanced meals a day.
But with a high rate of soup kitchens and food pantries in Albuquerque, there are many opportunities for concerned citizens to get involved and give back. Here, there are 28 locations (within the SoupKitchen411 and FoodPantries.org networks) for every 100k residents, compared with a list-average of just 7 locations per 100k residents.
Other cities in our top 25 with especially high rates of food pantries and soup kitchens include: Detroit, MI (24 per 100k); Jackson, MS (32 per 100k); Little Rock, AR (48 per 100k); and Cleveland, OH (28 per 100k). In these cities, it may be especially easy to find volunteer opportunities.
Our top 25 also includes a number of cities in which soup kitchens and food pantries are scarce relative to the population: Washington, D.C. (5 per 100k); Oklahoma City, OK (6 per 100k), San Francisco, CA (7 per 100k); Dallas, TX (6 per 100k); Austin, TX (6 per 100k); New York, NY (2 per 100k); and Jacksonville, FL (3 per 100k).
Falling short: how many meals are we short each year?
Among America’s 200 most populous cities, there is an average annual food budget shortfall of $24.4 million – the amount of money that all food-insecure residents within a city would need in order to bridge their meal gap for the year. Among the top 25 cities in our analysis, this figure was more than twice as high: $52.7 million is needed on average to bridge the meal gap.
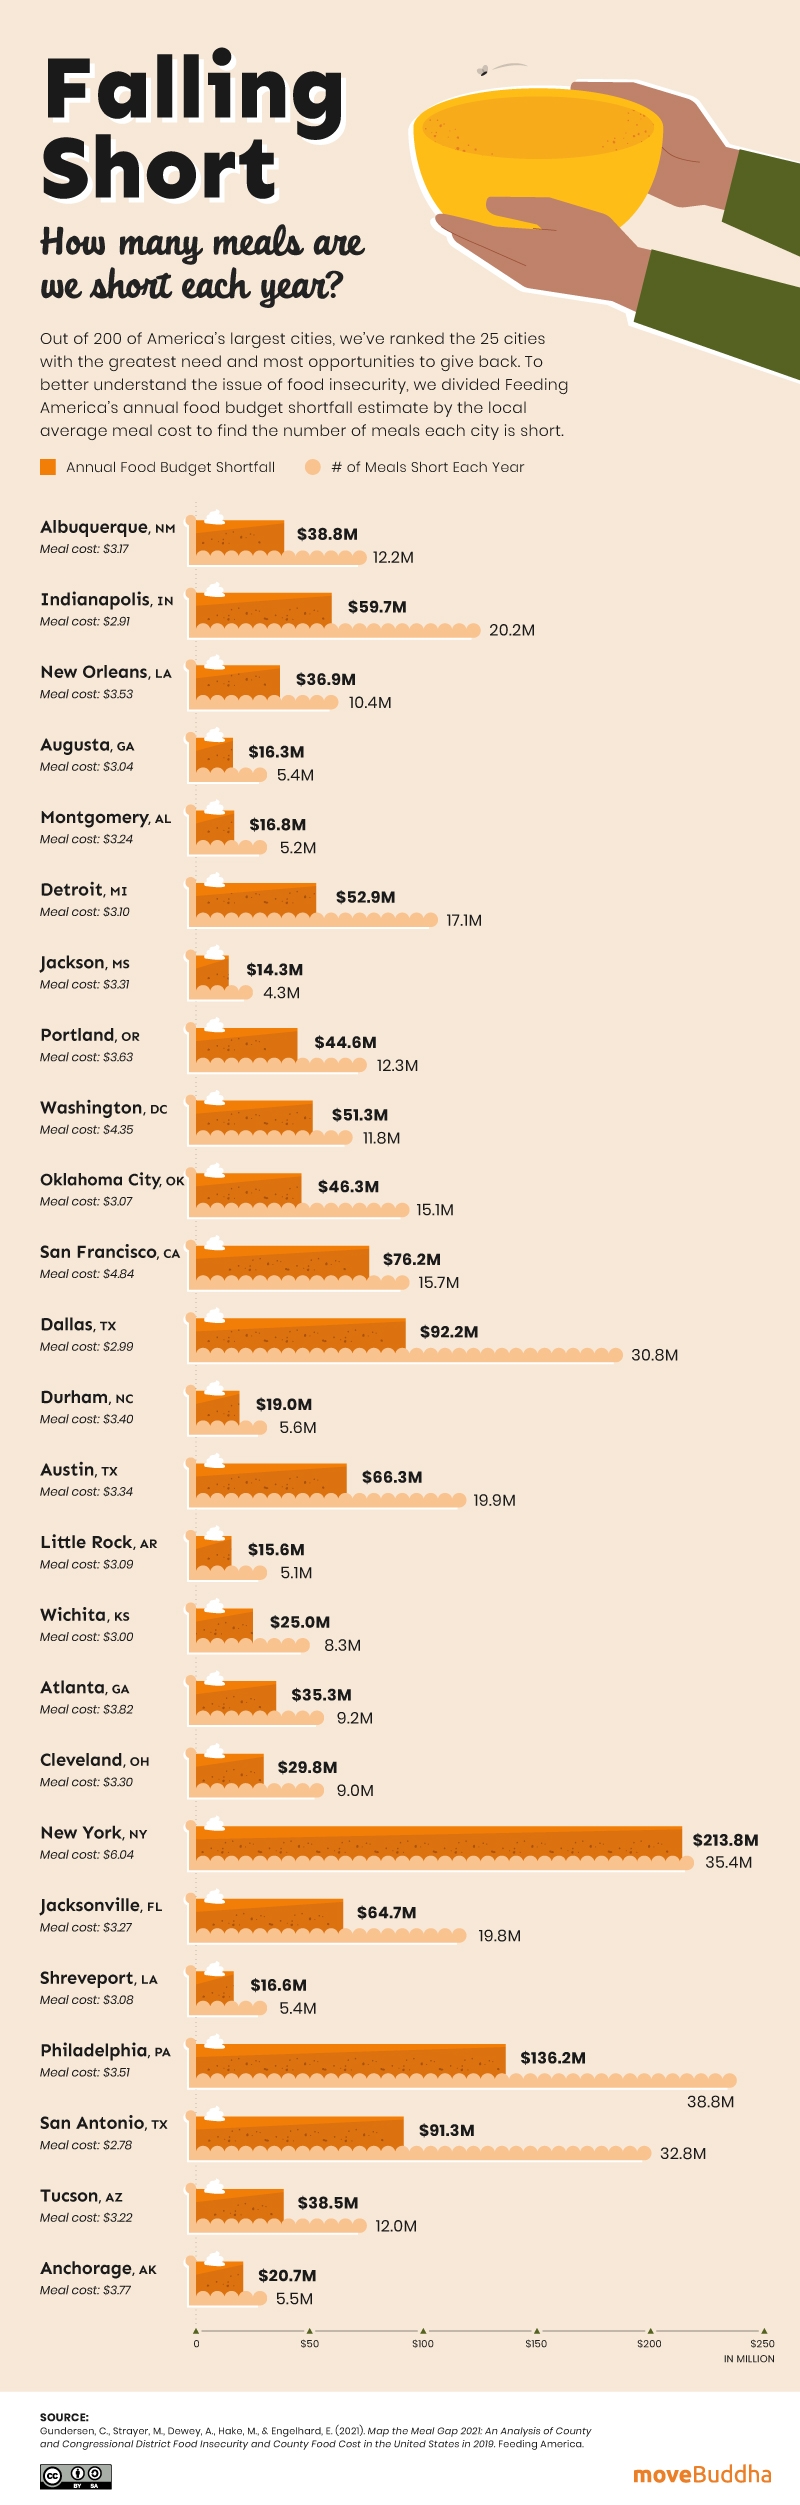
Perhaps unsurprisingly, America’s two largest cities also have the largest food budget shortfalls. Los Angeles (ranked #86) and New York (ranked #19) have more residents, and thus more food-insecure residents, than other cities in America. Additionally, high costs of living make for an additional hurdle for families struggling to find the cash for a meal.
While New York may have the largest food budget shortfall among our top 25 ranked cities, it is Philadelphia where the highest number of meals are missed each year. The food-insecure population of Philadelphia misses a cumulative 38.8 million meals per year, or the equivalent of skipping dinner every other day. Among our top 25 cities, Philadelphia shows an especially high degree of need according to a number of factors: 27.6% of Philly households receive SNAP benefits (list-average: 10.5%) and 32% of children in Philly live in poverty (list-average: 8%).
Other cities in our top 25 with particularly high numbers of missed meals per year include: Indianapolis, IN (20.1 million); Detroit, MI (17.1 million); Austin, TX (19.8 million); New York, NY (35.4 million); Jacksonville, FL (19.8 million); and San Antonio, TX (32.8 million). In these cities, food drives and meal kits may be especially helpful for food-insecure residents.
Sources and Methodology
For each city, we assigned a relative score of 0 to 10 for a range of factors related to food insecurity, assistance programs, and need. Scores closer to 0 indicate the city had a low need compared to other cities on the list, whereas scores closer to 10 indicate a greater need.
For each category, a cumulative score was calculated based on the average score of all relevant factors. The final score was calculated from the average of all category scores, with a double weight given to the Giving Opportunities category. Cities were ranked based on this final score.
Sources
Raw data for these scores came from the following sources.
Food Insecurity Score
% of population receiving SNAP benefits – US Census Bureau
Food Insecurity Score by county, adj.* – County Health Rankings
% of food insecure residents by county, adj.*- Feeding America, Map the Meal Gap**
% of students eligible for free or reduced school lunches – National Center for Education Statistics
Housing Insecurity Score
% of population experiencing severe housing problems, adj.* – County Health Rankings
Homelessness by state, adj.* – Department of Housing and Urban Development
Shelter beds in excess/lacking by county, adj.* – Department of Housing and Urban Development
Financial Insecurity Score
Income inequality by county, adj.* – County Health Rankings
Children in poverty by county, adj.* – County Health Rankings
Life Insecurity Score
Premature deaths by county, adj.* – County Health Rankings
Low birthrate by county, adj.* – County Health Rankings
Food Budget Shortfall Score
Budget shortfalls, adj.* – Feeding America, Map the Meal Gap**
Giving Opportunities (Double Weighted)
Rate of food pantries and soup kitchens within the following networks:
*Data based on county or state populations was adjusted according to city populations.
** Gundersen, C., Strayer, M., Dewey, A., Hake, M., & Engelhard, E. (2021). Map the Meal Gap 2021: An Analysis of County and Congressional District Food Insecurity and County Food Cost in the United States in 2019. Feeding America.
Not what you were looking for?
Check out other categories that can help you find the information you need!

