Bucking the Buckeye State: The moveBuddha 2022-2023 Ohio Migration Report

Ohio has seen some rusty years since its manufacturing heydays. Today, moveBuddha data shows times are still tough when it comes to domestic migration. The state has seen a consistently higher number of exits from domestic moves. The state ranked #13 for highest outflow in 2022, and is ranked #6 in the early part of 2023.
Big Takeaways:
- Ohio was ranked #13 for most outflow in 2022, and sits at #6 for highest outflow at the start of 2023.
- Ohio is trading residents primarily with Florida, Texas, and California, accounting for roughly 33% of all moves out in 2022. Meanwhile, these same states account for about 30% of all moves in the same year according to moveBuddha data.
- While most areas included in the moveBuddha data are seeing higher outflow, Medina is at 144 moves in to 100 moves out largely thanks to booming business and lower taxes. Other thriving cities include Youngstown (143 to 100), as its real estate averages just $57,000 according to the Zillow Home Value Index (ZHVI). Springfield ranks #3, with relatively affordable housing hovering around $156,000 according to the same source.
- The State’s biggest city, Columbus, is seeing more outflow than inflow in 2022 (72 to 100) despite its 18-year high housing construction.
Are people still moving out of Ohio?
At first glance, Ohio has a lot going for it.
Not only does it offer the beautiful Appalachian foothills, but it also boasts big tourist attractions like the Rock & Roll Hall of Fame in Cleveland.
However, the Rust Belt state population has suffered from locals leaving for the past decade. Between 2010 and 2019, the population of Ohio increased by a slim 1.3%.
Since then, Ohio has been among the nation’s exodus states.
A major culprit for locals looking out is the job outlook. Many have followed more lucrative and wider opportunities outside of the state, especially during the pandemic. Ironically, the state’s business sector is having trouble filling positions in both big companies and smaller businesses. In recent news, state lawmakers are attempting to fill the gap by pushing a bill to allow teens to work longer hours during the school year.
There could be other socioeconomic factors at play, too. Recent research shows that Ohio’s child poverty ranks #37 worst out of the 50 states in 2021 – while the state ranks #36 out of 50 by median income. As the state looks to stimulate the local economy with a surge of new projects, we took a look a moveBuddha’s latest moving data to see what patterns have emerged across the state over the past few years.
Table of Contents
I. Ohio Moves: Statewide trends from the last decade and into 2022
II. 2022 Forecast: Which Ohio cities are surging in popularity and which are losing the most residents?
III. Sources and Methodology
I. Ohio Exodus

While population growth stagnated in the decade before the pandemic, census data shows the overall population of Ohio dropped from July 2021 to July 2022 – bolstered only by an increasing birth rate in some less densely populated areas of the state.
Another quandary caused by the pandemic, the displacement of more than 1 million Ohio workers. As of March 2022, the state was still down about 146,000 jobs. So, it’s no surprise that a report from United Van Lines found that about 40% of those moving out of Ohio in 2022 were moving primarily due to work.
What may be driving moves out of Ohio?
- High taxes: It’s a trend we’ve seen from New York to Illinois. States with high taxes are seeing residents exit en masse — Ohio fits the bill. The state ranks #31 of the 50 for highest Property Taxes per Capita according to the Tax Foundation and the combined state and local tax burden measure up to about 10.3%
- A struggle to rebound from recessions: Since the 2008 recession Ohio has been struggling to recoup losses. With another recession in the books, the state is again struggling to recover. In Ohio, these downturns have been especially hard for black working men and women.
- Low pay for the state’s most common jobs: Yes, wages have been lifted for the state’s most common jobs. However, this wage increase falls in tandem with a surge of inflation, meaning the increases are only mildly helping to balance the score. In fact, wages are so low for 4 of the top 10 occupations in the state that a full-time worker with a family of 3 would qualify for food assistance.
- Retirement: Ohio is considered one of the best places in the country to retire, based on affordability and healthcare that score high in the Midwest. However, there’s also evidence that retirees are leaving the Buckeye state. Only 17.8% of the population in Ohio is aged 65+, compared to a popular retirement state like Florida, at 21.1%.
Which states are benefiting from Ohio exits?
The top move-to states are Florida (14%), Texas (10.2%), and California (8.5%).
The top three states that dominate moves from Ohio echo trends we've seen across other exodus states. And with the exception of California, the top states to move to are some of the most popular states to move to since early 2020: Florida, Texas, North Carolina (#4 top move-to state), Georgia (#5), and Arizona (#6).
While Ohio's overall cost of living (including groceries, housing, utilities, and transportation) is among the lowest in the country at 91.3, the state income tax rates for Texas and Florida are 0% (compared to up to 3.99% in Ohio, with some jurisdictions charging an additional local income tax.)
A few exceptions to the flight to lower tax havens are Ohioans choosing to move to California (#3) and Illinois (#7). What may be attracting moves to these states? Likely culprit: job opportunity.
Three states are trading populations with Ohio
Residents of these same three states are moving to Ohio in the biggest concentrations, accounting for a total of roughly 30% of the inflow.
This may be because Ohio has much lower home values, allowing people to buy real estate. For example, Zillow shows the average Ohio home value sits at $199,518, while that number is $718,687 in California. The cost of living index in California is also much higher than Ohio, sitting at 142.2.
While politics in Ohio are mainly conservative like Florida and Texas – which would make for an easier move – the state may be swapping tech workers with California as Ohio experiences a boom.
II. 2022 Moves: Which Ohio cities lost or gained the most from moves in and out, according to moveBuddha data?

Analyzing searches from the moveBuddha Moving Calculator in 2022, we identified all the Ohio cities that moveBuddha users are searching, whether to move into or out of.
Limiting these results to cities with at least 25 inbound searches and 25 outbound searches to avoid outliers, we honed in on 62 Ohio cities seeing the most activity.
Of the 62 cities we analyzed, 39 have a negative move in-to-out ratio, the worst being Blacklick (45 to 100), and Bowling Green (50 to 100).
The cities with the highest positive move ratios are: #1 Medina (144 to 100), #2 Youngstown (143 to 100), and #3 Springfield (136 to 100).
Let's take a better look at what could be attracting people to these relatively unpopulated areas...
Big gains for smaller, affordable cities
With the exception of the #1 spot (Medina), the affordability of homes seems to be a big draw among the other top Ohio migration destinations in 2022. The average cost of a home across the top 5 cities to move to is about $232K, ranging from $58K in #2 Youngstown to Medina's $357,172 (just a bit higher than the national average of $327,514).
Many of the top places for high inflow ratios, according to moveBuddha data, are smaller communities within the Columbus geographic area. The city itself is feeling the crunch of a housing shortage, especially in the wake of a new Intel manufacturing project. This could be what is pushing moves the outer edges of this metropolitan area.
Meanwhile, housing inventory across big Ohio cities is being bought up by investors, making finding affordable housing more difficult. Cincinnati, for example, has seen its home values jump 33% since 2020.
The largest city that showed growth in the state is Youngstown on the state's eastern boundary, where the residential real estate sits at under $60,000, according to ZHVI. But the attractive home prices may not stick around with the rising popularity – home values in Youngstown are up 73% from 2020.
Top 5 Cities Seeing Higher Inflow:
#1 Medina, OH

CBSA: Cleveland-Elyria, OH
County: Medina
Population (2021): 25,934
Zillow Home Value (Dec 2022): $357,172
Zillow Observed Rent Index (Dec): $1,782
Median Income: $66,691
Median Age: 38.9
College Education or Higher: 35%
Unemployment Rate: 3.9%
Medina is close to Cleveland with all of its attractions, including the Rock & Roll Hall of Fame, without the huge crowd. (Medina has 2,252 people per square mile, compared to 4,793 in Cleveland.) It also boasts a strong education system, with a wide variety of public and private schools in the area. This is ideal for younger families – likely why the average age in Medina is 38.9. Lower density and quality amenities for school-aged children is bringing people here.
#2 Youngstown, OH

CBSA: Youngstown-Warren-Boardman, OH-PA
County: Mahoning
Census Population (2021): 60,270
Zillow Home Value (Dec 2022): $57,802
Zillow Observed Rent Index (Dec): $857
Median Income: $30,129
Median Age: 39.8
College Education or Higher: 14.6%
Unemployment Rate: 13.6%
Youngstown has an advantage of being placed almost right between Cleveland and Pittsburgh, giving fairly easy access to both big cities. The area is seeing a revival, as vacant storefronts and restaurants are coming back to life, and an arts district is forming along with a planned amphitheater. Of course, it's hard to ignore the affordability of homes here, although the values are steadily rising. A thriving downtown and a cost of living index of 66.1 (lower than Ohio's state average) are big draws.
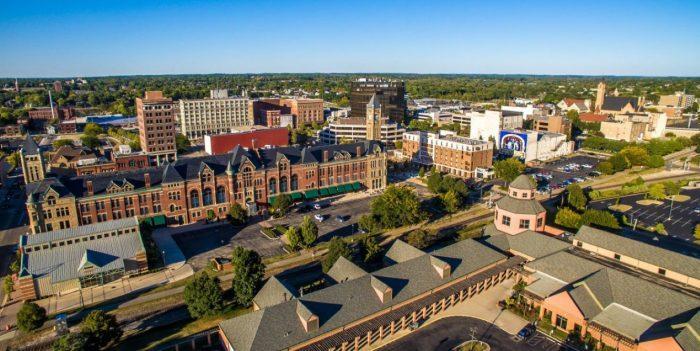
#3. Springfield, OH
CBSA: Springfield, OH
County: Clark
Census Population (2021): 58,763
Zillow Home Value (Dec): $155,674
Zillow Observed Rent Index (Dec): $797
Median Income: $39,344
Median Age: 35.4
College Education or Higher: 15.2%
Unemployment Rate: 8.9%
In recent years, Springfield was a dwindling area facing tough economic challenges. However, it's making a comeback with new restaurants, eye-catching landmarks, the Smithsonian-affiliated Springfield Museum of Art, as well as a high school that contains a STEM education center. Real estate here is still priced well below the state's average. The reasonable cost of living and budding amenities are two big reasons to move here.
#4 Marysville, OH
CBSA: Columbus, OH
County: Union
Census Population (2021): 26,223
Zillow Home Value (Dec): $347,935
Zillow Observed Rent Index (Dec): $1,615
Median Income: $79,016
Median Age: 36.9
College Education or Higher: 31.9%
Unemployment Rate: 2.6%
As the main hub for Union County, it's home to the local legislature. But that's not what is bringing people here. It's more likely the local farmers' market, community events, and scenic walks near the water. A bustling lifestyle without being in a densely populated city is a draw.
#5 Athens, OH

CBSA: Athens, OH
County: Athens
Census Population (2020): 24,507
Zillow Home Value (Dec): $242,243
Zillow Observed Rent Index (Dec): $950
Median Income: $33,524
Median Age: 21.6
College Education or Higher: 63.7%
Unemployment Rate: 6.4%
Athens is home to Ohio University with about 21,000 students, which explains the relatively young population. It also has affordable real estate, as well as reasonable rental rates, no doubt due to student housing. With its breweries/wineries, art scene, state park, and all around fun vibe, it's easy to see how Athens would crack the top cities for inflow.
5 Cities Seeing Higher Outflow:
#1 Blacklick, OH

CBSA: Columbus, OH
County: Franklin
Census Population (2020): 30,901
Zillow Home Value (Dec 2022): $363,311
Zillow Observed Rent Index (Dec): $2,101
Median Income: $89,318
Median Age: 33.2
College Education or Higher: N/A
Unemployment Rate: N/A
It's difficult to pin down exactly why Blacklick is at the very bottom in terms of in to out ratio (45 to 100) according to moveBuddha data. However, Zillow numbers show home values have risen 35% since 2020, which might make it more unappealing for buyers. Rent is also high compared to other areas near Columbus. Ohio's minimum wage laws ($10.10/hr compared to $7.25 federally) may also be a factor, as some businesses relocate. Economics seems to be the biggest factor for the exodus.
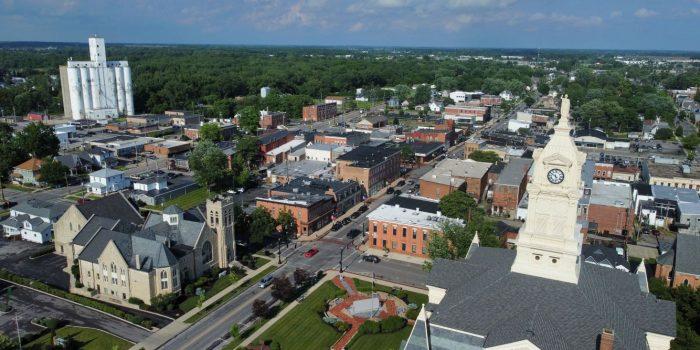
#2 Bowling Green, Ohio

CBSA: Toledo, OH
County: Wood
Census Population (2021): 30,677
Zillow Home Value (Dec 2022): $363,276
Zillow Observed Rent Index (Dec): $768
Median Income: $39,210
Median Age: 22.5
College Education or Higher: 42.7%
Unemployment Rate: 6.5%
Bowling Green is a university town, which is why the population is young and educated. During a stay-at-home order, the city experienced layoffs and evictions early in the pandemic. More recently, efforts have been made to encourage immigrants to fill local labor shortages. Limited job opportunities and diversity (85.3% of the population is Caucasian) could be negative factors.
#3. New Albany, OH

CBSA: Columbus, OH
County: Franklin
Census Population (2021): 10,854
Zillow Home Value (Dec): $664,905
Zillow Observed Rent Index (Dec): $1,754
Median Income: $200,580
Median Age: 39.2
College Education or Higher: 75.5%
Unemployment Rate: 3.5%
Affordability in this relatively small city is shrinking, as home values have shot up 44% since 2020 according to Zillow. Politics may also play a role: most people in New Albany are conservative, while only 40% of Ohio as a whole leans toward the right politically. High costs and shifting political ideology may be driving some people away.
#4. Middletown, OH

CBSA: Cincinnati, OH-KY-IN
County: Butler
Census Population (2021): 50,998
Zillow Home Value (Dec): $167,995
Zillow Observed Rent Index (Dec): $1,065
Median Income: $42,290
Median Age: 38.4
College Education or Higher: 15.6%
Unemployment Rate: 6.4%
While home values are lower than the state's average of $199,518, unemployment is relatively high compared to thriving areas in the state. The Cincinnati suburb has a relatively high child poverty rate of 42.9, putting it 15th highest in this category state-wide. Property crimes (theft and arson) are also higher here than the national average. Some people may be leaving to seek a higher quality of life.
#5. Lewis Center, OH

CBSA: Columbus, OH
County: Delaware
Census Population (2020): 33,238
Realtor.com (Dec): $479,900
Zillow Observed Rent Index (Dec): $1,309
Median Income: $137,408
Median Age: 35.5
College Education or Higher: N/A
Unemployment Rate: 3.8%
Real estate values have shot up about 44% in Lewis Center since only February 2022, making the market less accessible. The local job market took significant to severe damage during the pandemic, which may have prompted residents to leave for other opportunities.
The lowdown on Ohio

It's not all bad news for Ohio. The state is working on initiatives to rebuild and grow, which may dramatically change the landscape for laborers across the state.
Honda is adding an electric vehicle battery plant and reworking its existing factories to make electric vehicles, while General Motors is doing the same to its existing Toledo plant.
Meanwhile, Intel is adding a 1,000 acre complex in the state to build semiconductors. This could point to a tech boom for Ohio.
More work is being created in the public sector through a major project to revamp the Brent Spence Bridge connecting the Buckeye State to Kentucky. The project will employ crews for up to a decade.
Other good news: compared to many other states, real estate in Ohio is quite affordable. Plus, the climate is largely shielded from major weather events, it's practically a climate haven. In fact, two major cities are among the 10 safest places in the U.S. in terms of natural disasters.
Right now, Ohio needs to build more homes in major cities to keep up with demand, which could be pushed behind schedule due to a labour shortage. Areas like Blacklick, which is losing the highest ratio of residents, have a planned residential development to accommodate the new Intel facility workers moving in.
The next year and beyond should be interesting for Ohio. Could the migration tides be shifting in its favor? Or will the roots of problems that have held the state back over the past few years keep it from moving forward to adapt and invite newcomers back in? Only time will tell.
Methodology
This report primarily uses data sourced from moveBuddha’s Moving Cost Calculator with supplemental city-specific details from the U.S. Census Bureau. To understand the cost of area homes and area rental costs, we refer to Zillow data.
moveBuddha proprietary data
This data was collected from January 1, 2022, through December 31, 2022, and includes searches across the nation by individuals who were either planning to move or hire a moving company throughout 2022. We also include a reference to data collected in January 2023.
More information about our move data and in-to-out ratio equation can be found in our annual Migration Report.
U.S. Census Bureau data
Unless otherwise indicated, supplemental city-specific data was sourced from:
- U.S. Census Population Data: Population data
- American Community Survey: Median income, median age, college education percentages, and the unemployment rate
Zillow — Zillow Home Value Index (ZHVI) and Zillow Observed Rent Index (ZORI)
The Zillow Home Value Index or ZHVI provides us with the typical single-family home value within each city at a given period of time.
The Zillow Observed Rent Index or ZORI provides us with the "smoothed measure of the typical observed market rate rent across a given region."
Image attribution:
[1] Bowling Green: Art Anderson, CC BY-SA 3.0 <https://creativecommons.org/licenses/by-sa/3.0>, via Wikimedia Commons
[2] New Albany: By Sixflashphoto - Own work, CC BY-SA 4.0, https://commons.wikimedia.org/w/index.php?curid=64319175
Not what you were looking for?
Check out other categories that can help you find the information you need!


.jpg)