The Best (and Worst) Cities for Living on $15/Hour
The last increase in the U.S. federal minimum wage took place in 2009, an increase from $6.55 to $7.25 per hour. Since then, the cost of living in the United States has increased by more than 20%. At today’s rate, a minimum wage worker with full-time hours makes only $15,080 annually, putting them well below the poverty line ($17,420) for a family of two.
Wage stagnation paired with soaring housing, healthcare, and education prices has given rise to the Fight for $15, an American political and labor movement advocating for a federal minimum wage more than twice its current rate. What began in 2012 as grassroots walk-outs of workers from fast-food chains in New York City has now blossomed into a nationwide movement embraced by as many as 62% of Americans.
The Fight for $15 has gained a great deal of traction over the past decade. Now, with the vocal support of the Biden Administration and the majority of Senate Democrats, a $15 federal minimum wage has never been closer within reach than it is today.
“The minimum wage must be a livable wage”: This is an oft-repeated argument made by advocates of the Fight for $15. But is $15/hour actually a livable wage across the United States?
We analyzed the cost of living in America’s 99 largest cities to find the most and least feasible locations for workers making $15/hour.
Looking for free tips on moving? Try out our moving cost calculator, or visit our pages on the best interstate movers, shipping containers, and plenty more.
Key Takeaways
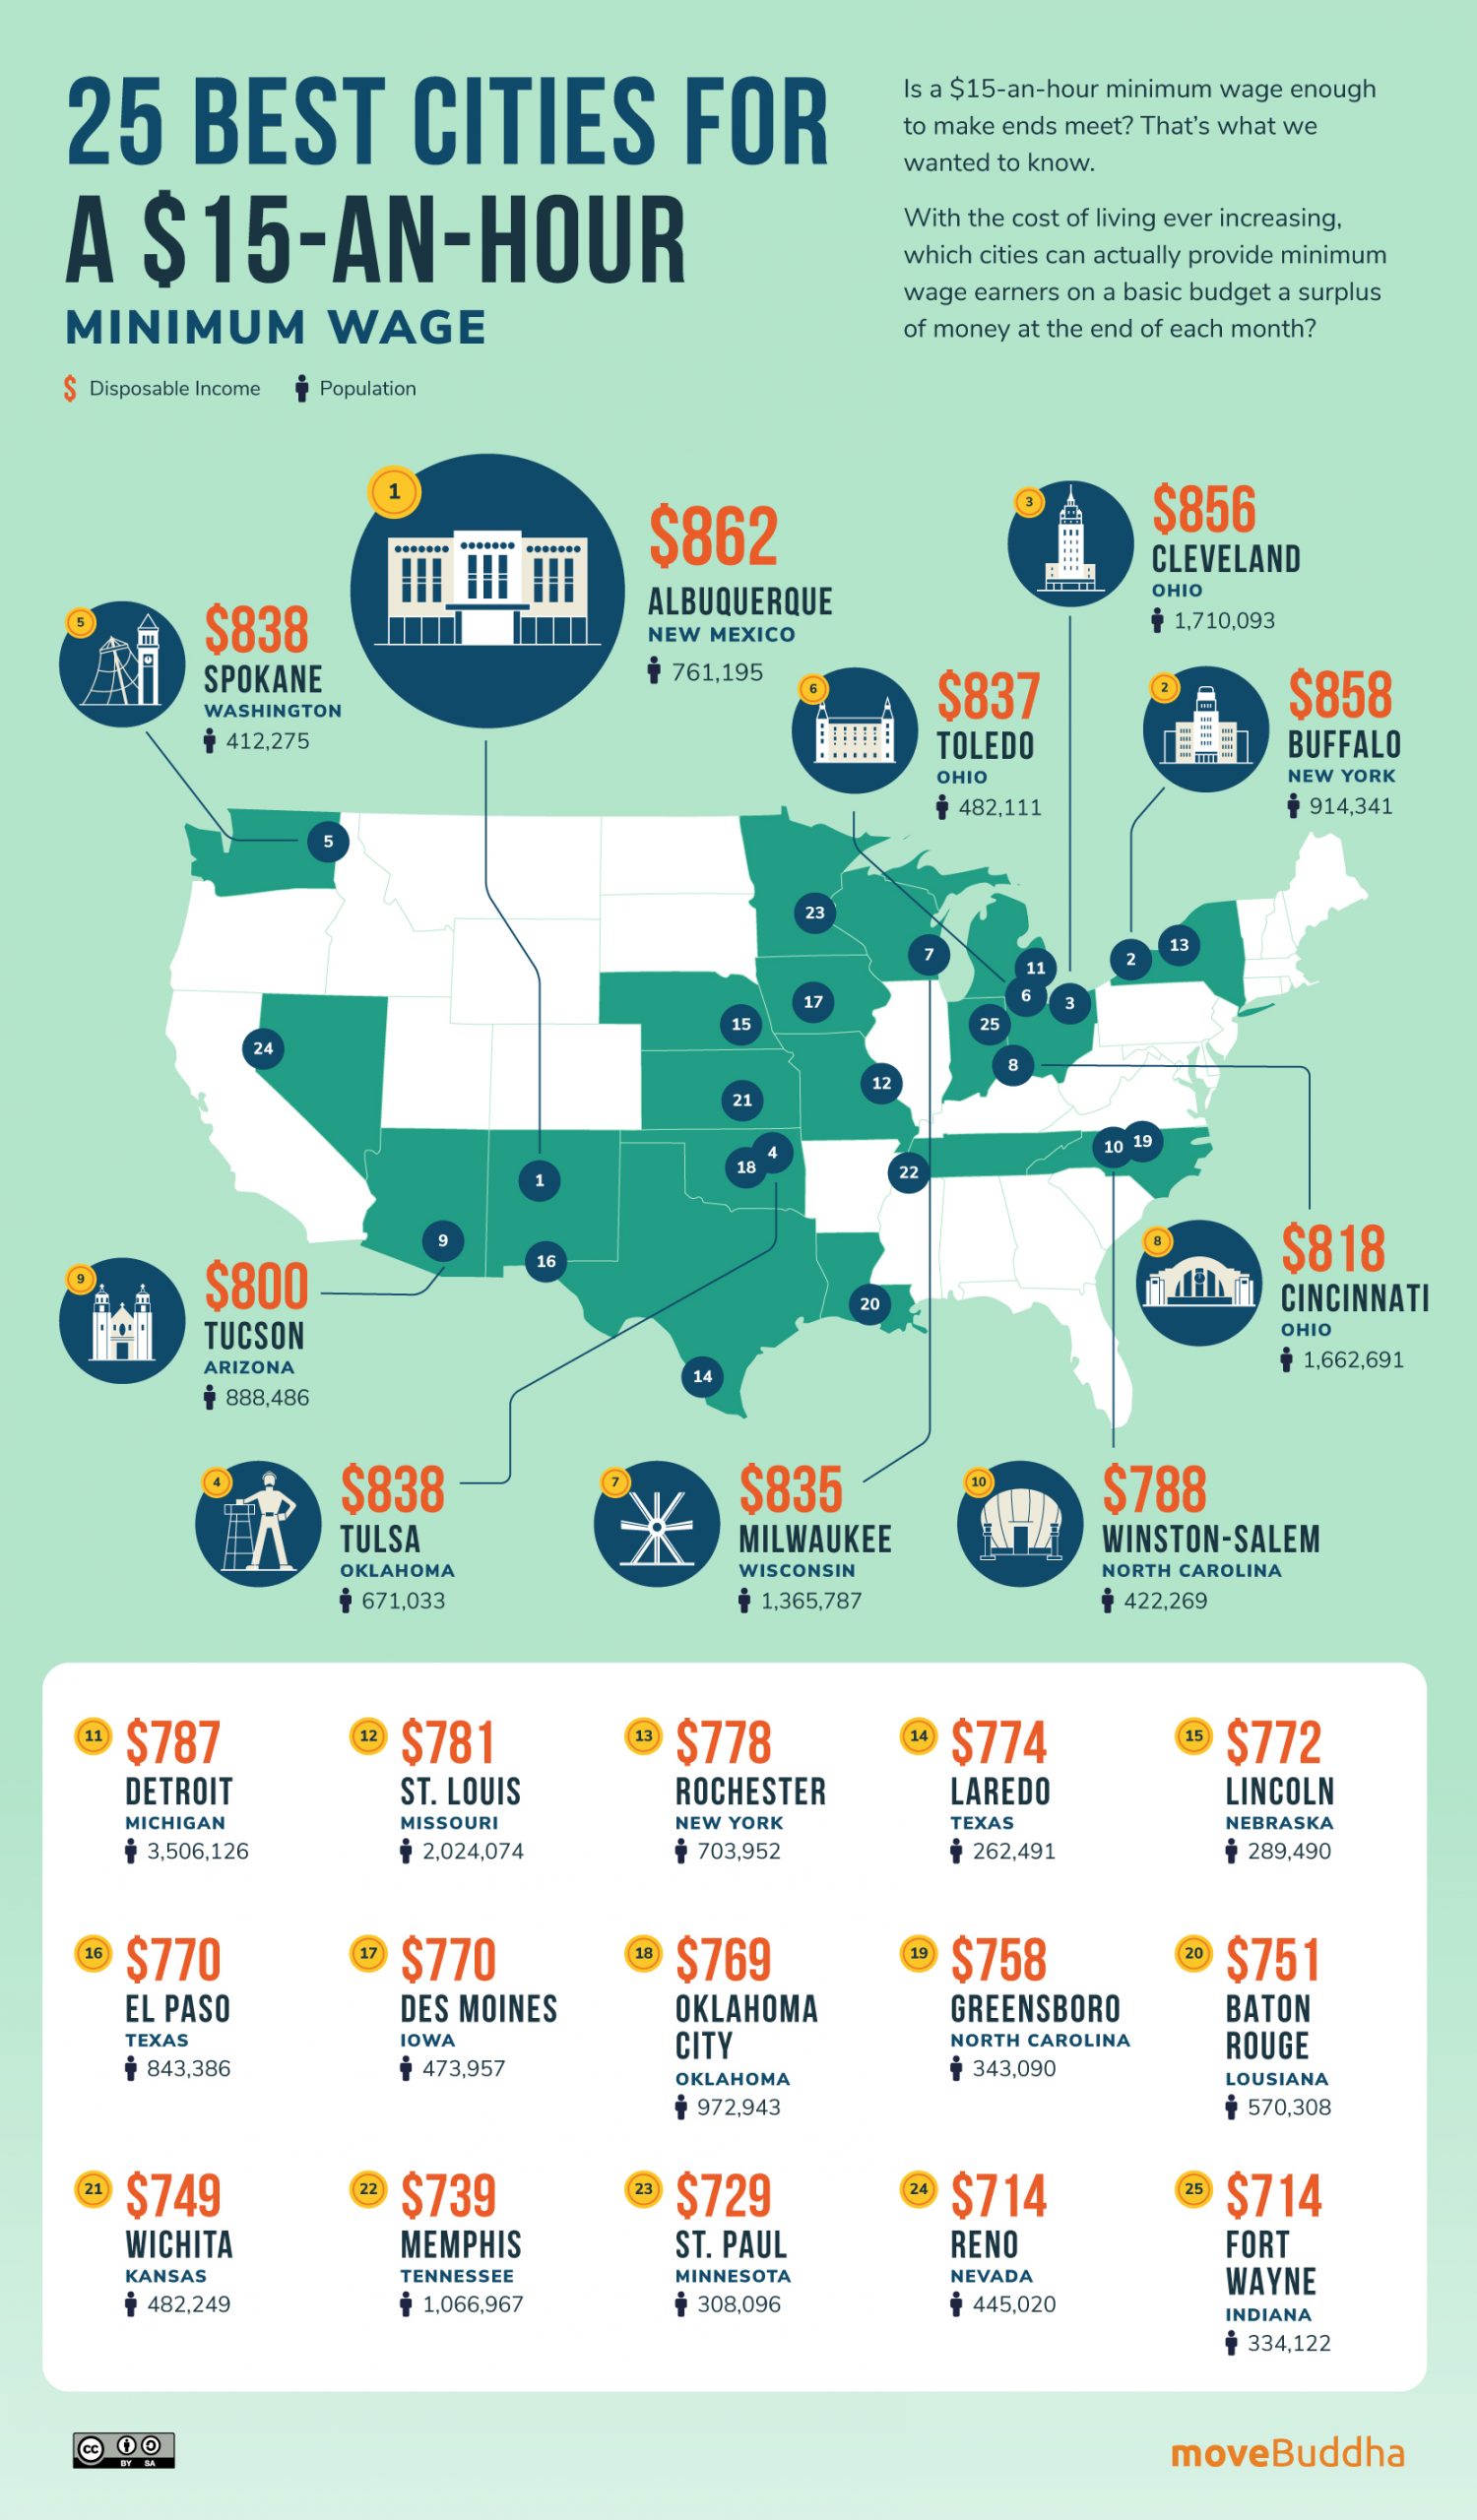
- Albuquerque, NM is the most livable American city for those making a wage of $15/hour. Here, full-time minimum wage workers could pocket as much as $862 per month (36% of their salary) after paying expenses.
- If the federal minimum wage were raised to $15/hour, it would be possible in 68 of America’s largest cities for a single person making minimum wage to have at least $480 left over every month (20% of their salary) after paying expenses.
- Many of the cities where a $15 minimum wage is least feasible are cities that already have a local minimum wage near $15/hour. For instance, the six least livable cities for $15 minimum wage are in California, where the statewide minimum wage is already $14. Seattle, the 9th least livable city for $15/hour, has a citywide minimum wage of $16.69 as of 2021.
- Unsurprisingly, the metric that best predicts livability at $15/hour are median rent prices. In 30 out of 101 cities analyzed, the median rent price is higher than 50% of what a person making $15/hour can expect to earn in a month..
How we found the best places to get by on $15/hour
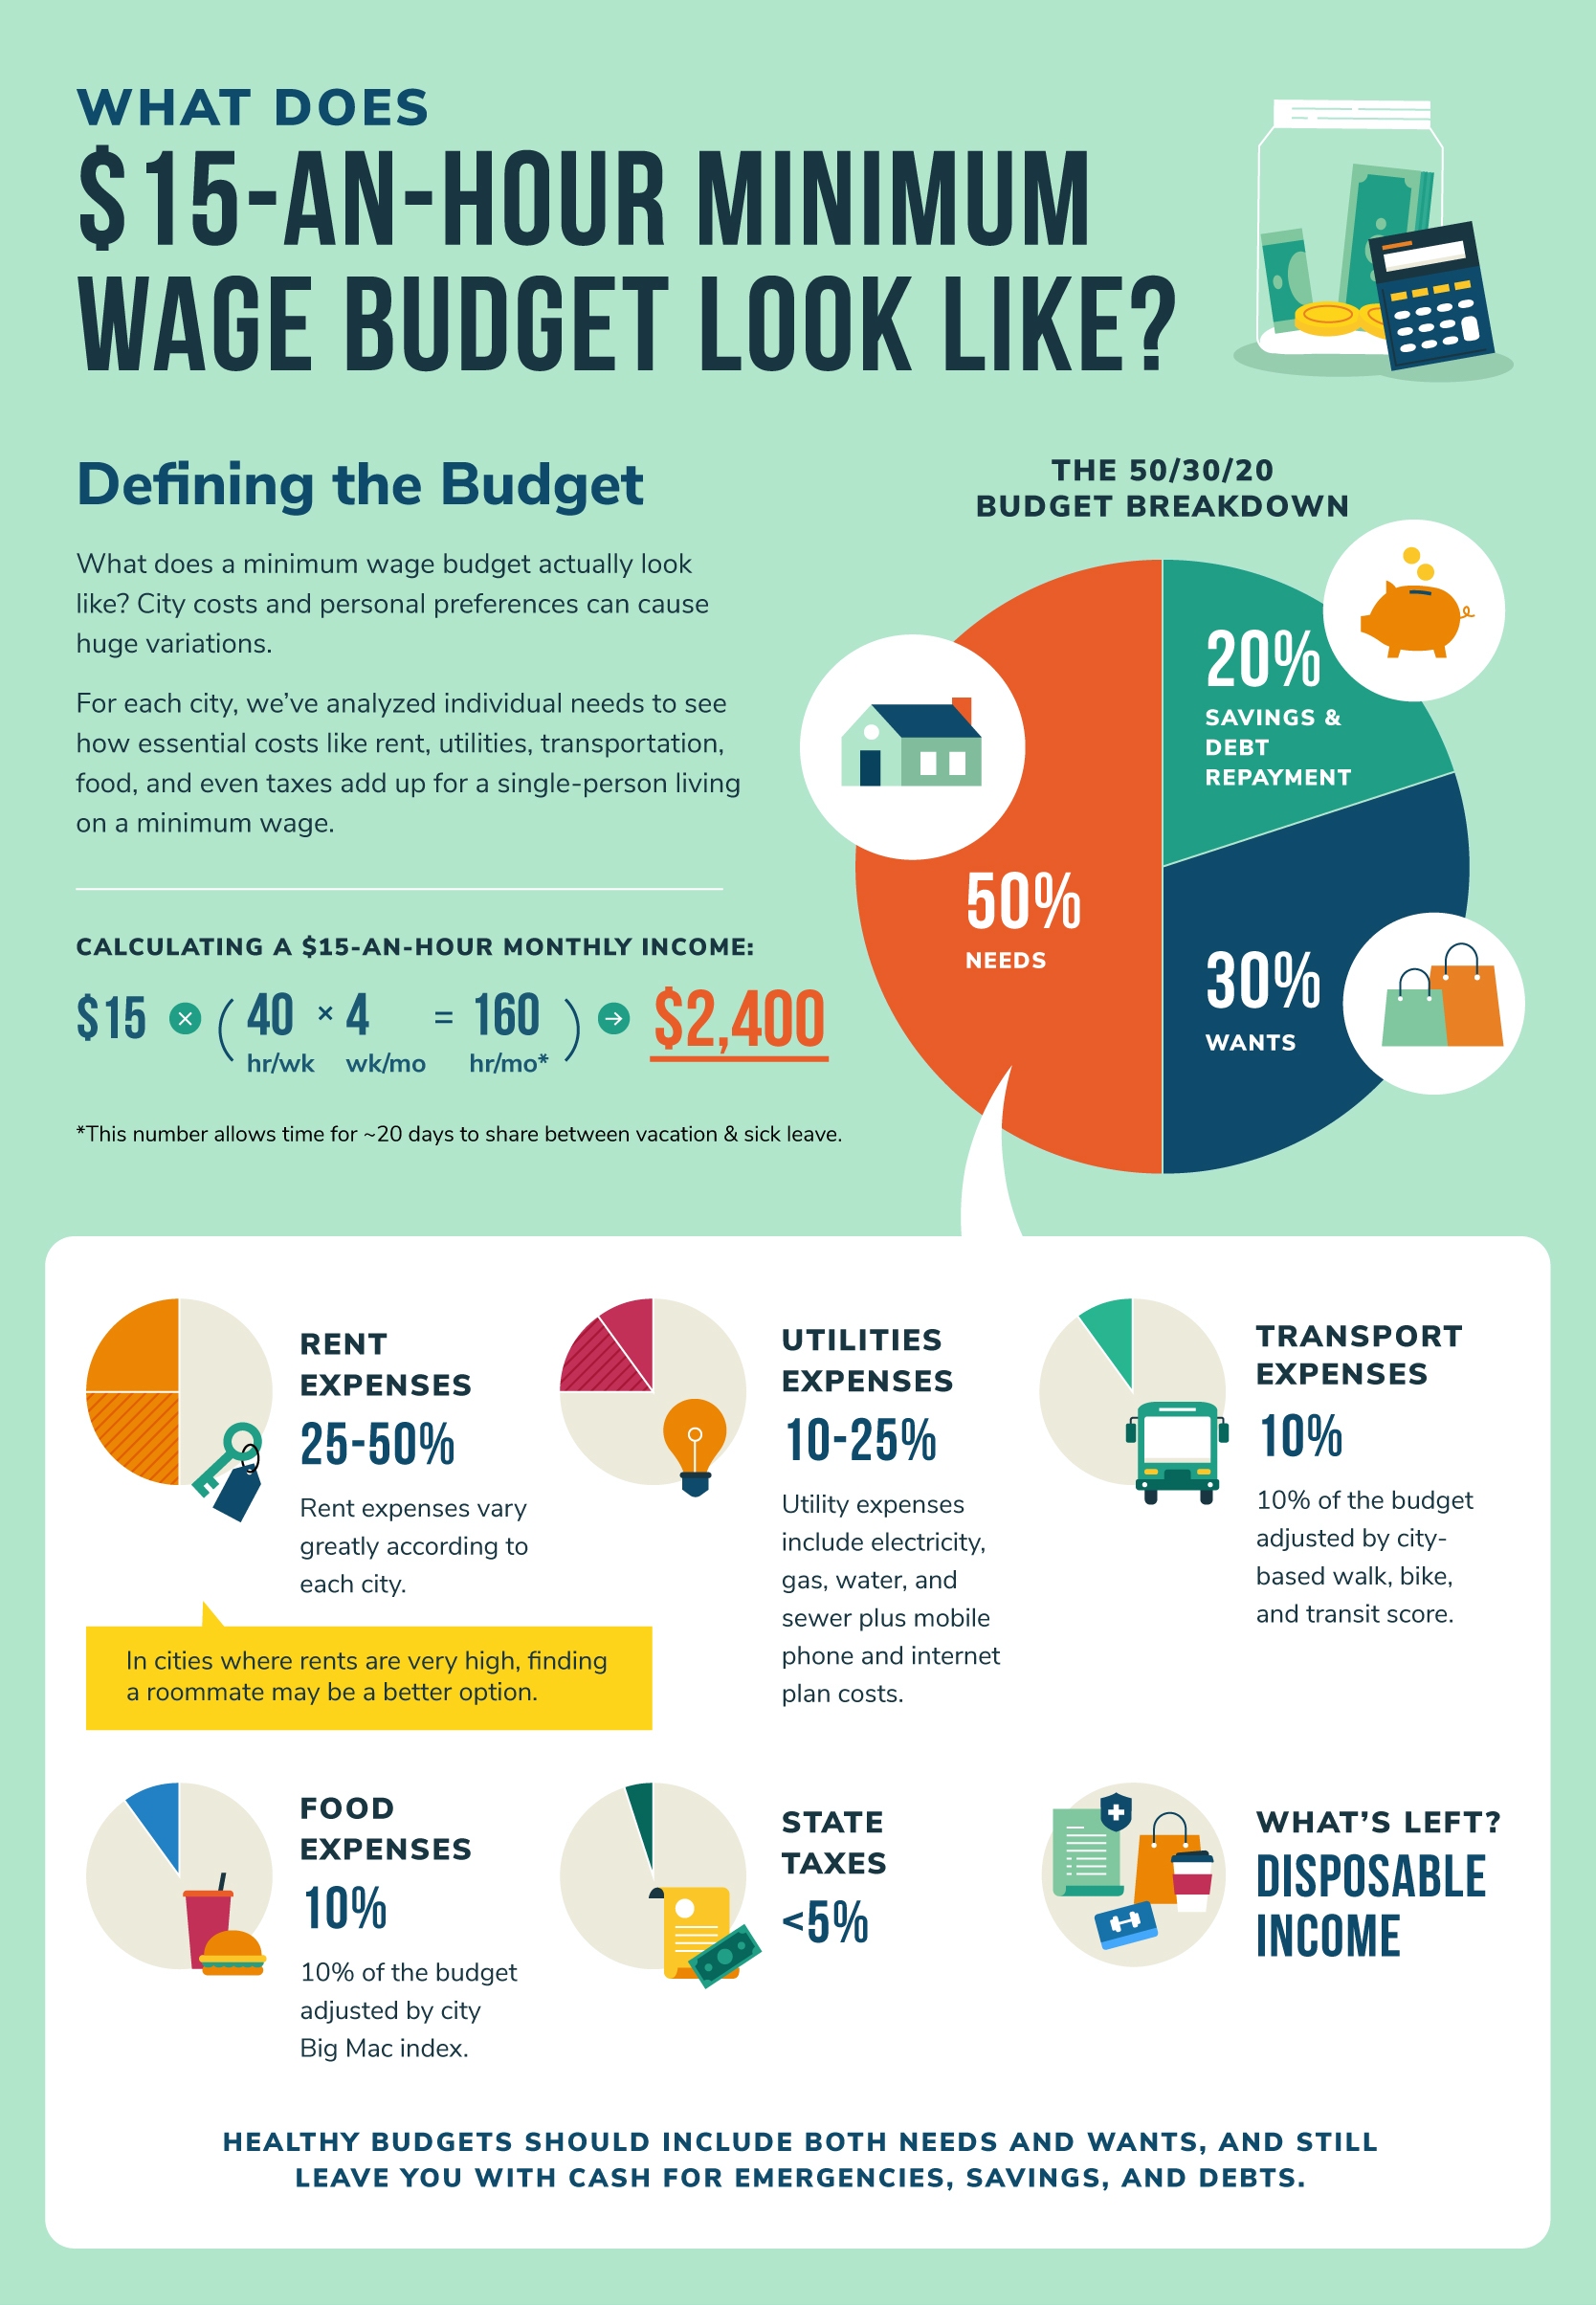
A single, childless person working 40 hours/week at $15/hour would earn a monthly paycheck of $2,400 before taxes.
Based on this figure, we created a monthly budget for America’s 99 largest cities (population 250,000+) that encompasses income tax, housing, utilities, food, and transportation costs. Using this budget, we ranked cities according to how much money a single person working full-time at $15/hour could expect to pocket each month after making ends meet.
Here are the factors included in our analysis:
- Income tax– Statewide standard yearly deduction, local income tax rates
- Utilities – Statewide averages for electricity, natural gas, 60 MBps internet, cable television, water, and sewage
- Housing – Median rent in the city
- Transportation – Citywide walkability, bike-ability, and public transit scores
Potential expenses not included in our analysis:
- Insurance of any kind (health, renter’s, homeowner’s, etc)
- Loans of any kind (student, credit card debt, etc.)
- Cell phone plan
- Car-related expenses (car payments, auto insurance, gasoline, depreciation)
- Property tax
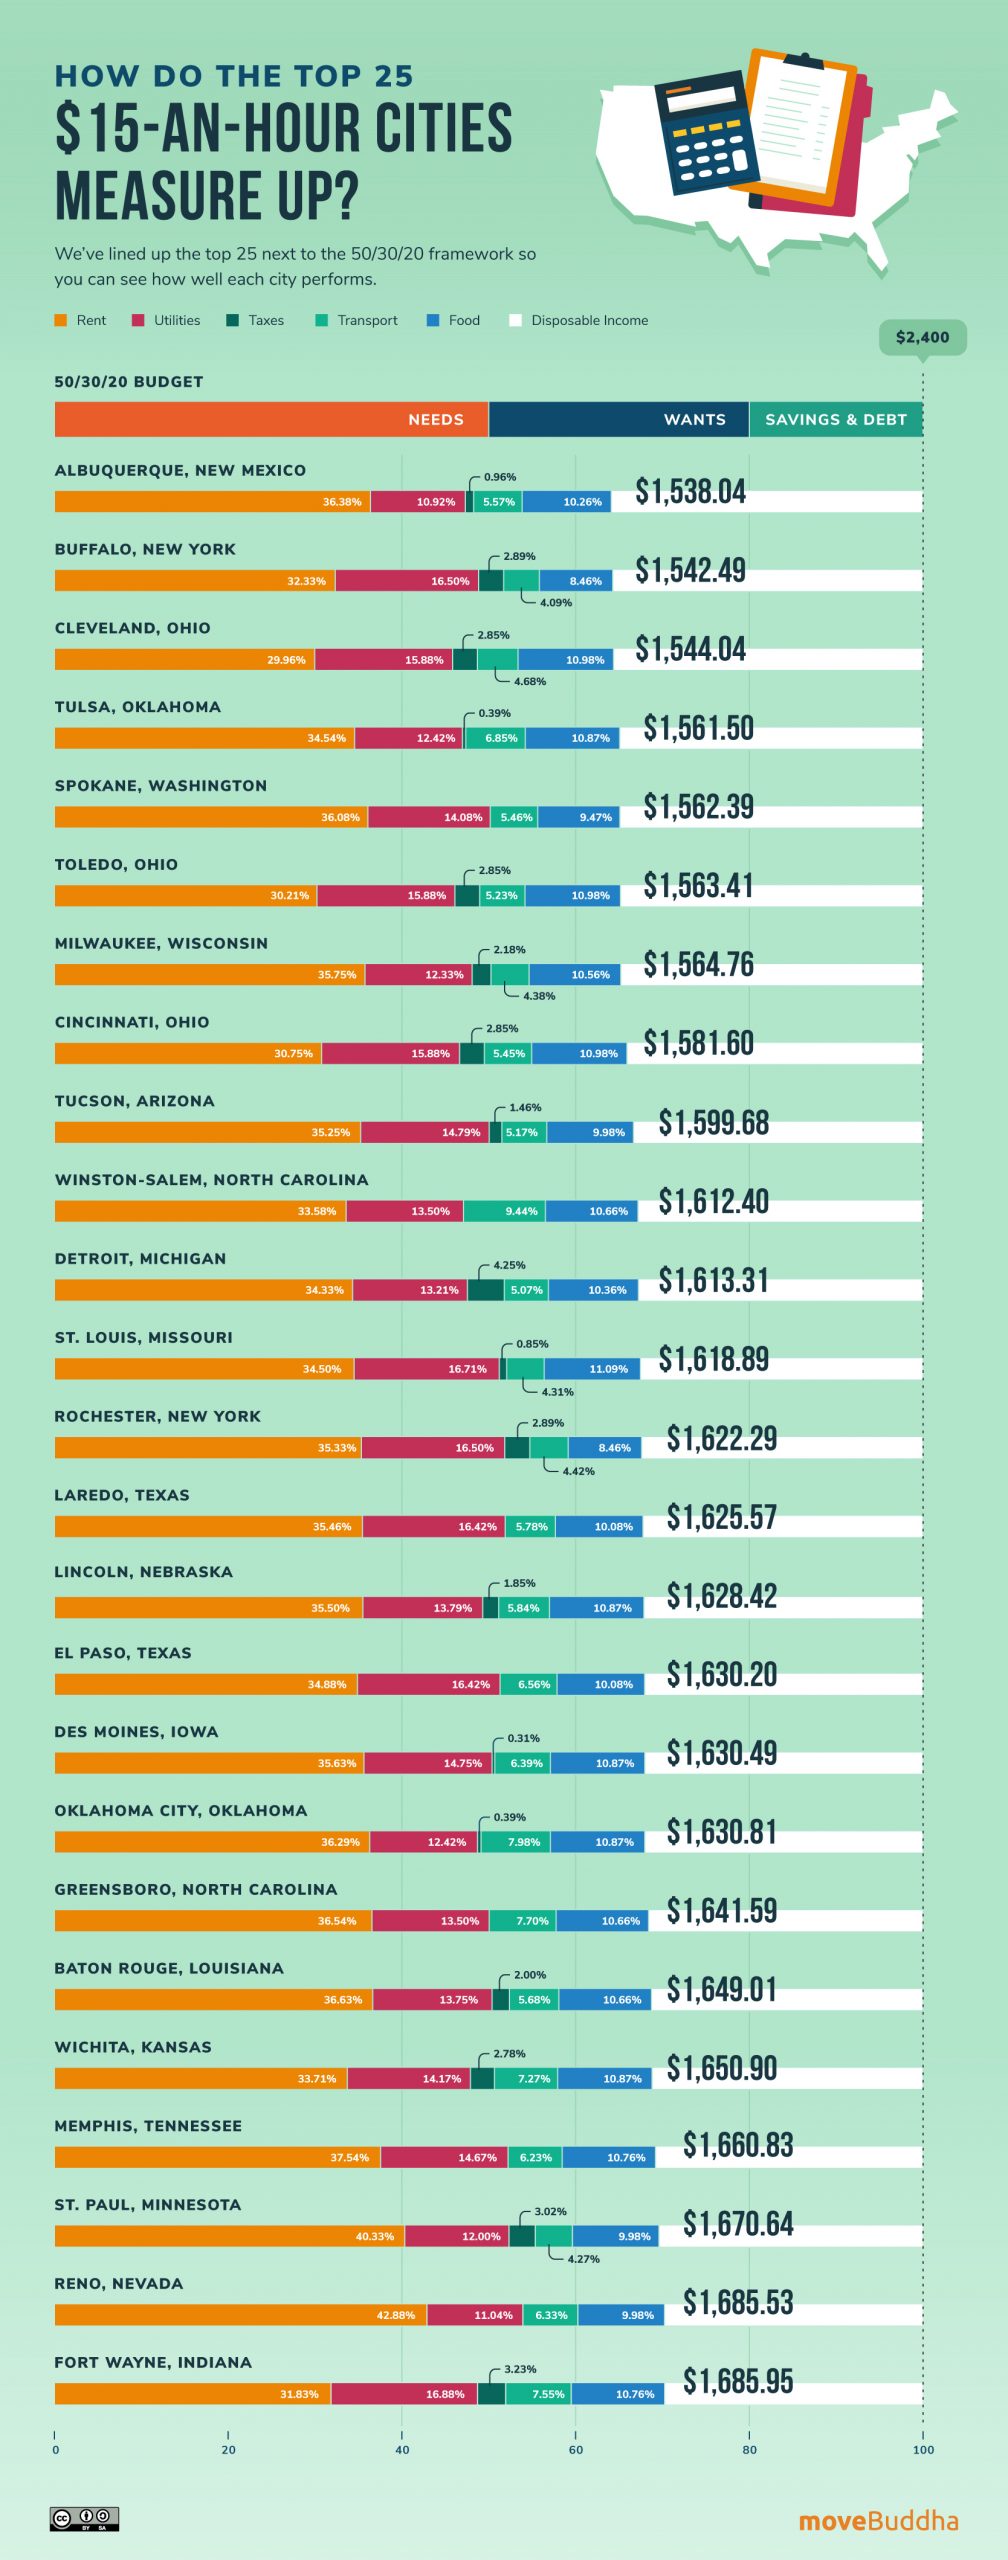
The 25 best cities for living on a $15/hour minimum wage
Living in one of these cities, full-time workers making $15/hour will have between $714 – $862 leftover each month after paying taxes, utilities, rent, food, and transportation costs, some 30% – 36% of their total salary.
Albuquerque, NM, our winner for the most livable city at $15/hour, features in many lists of America’s most affordable places to live. With low tax rates, a median rent cost of $873, utility costs significantly below the national average, and a walkable, bikeable city center with extensive bus routes, New Mexico’s largest city provides comfortable conditions for living on $2,400 a month.
Ohio is the best-represented state among our list of the most affordable cities for living on $15/hour. Cleveland (3rd), Toledo (6th), and Cincinnati (8th) rank so highly due to their incredibly low median rent prices. At $719-$738 per month, workers earning $15/hour in one of these Ohian cities need only budget about 30% of their income for rent.
30% of your income is precisely the proportion many personal finance experts advise a person should spend on housing. But this rule of thumb is becoming increasingly hard to follow, as roughly 1 in 4 Americans who rent now fork over more than 50% of their income to their landlords.
Indeed, our analysis showed that a $15 federal minimum wage can only help so much in solving the crisis of cost-burdened renters. Of the 99 cities we analyzed, only 12 cities had median rent costs below 35% of a $2,400 monthly salary. In fact, our list-average for rent costs was $1,124, or roughly 47% of a $15/hour monthly income. 30 cities we analyzed had rent costs beyond 50% of what workers making $15/hour can expect to earn each month.
The 25 worst cities for making ends meet at $15/hour
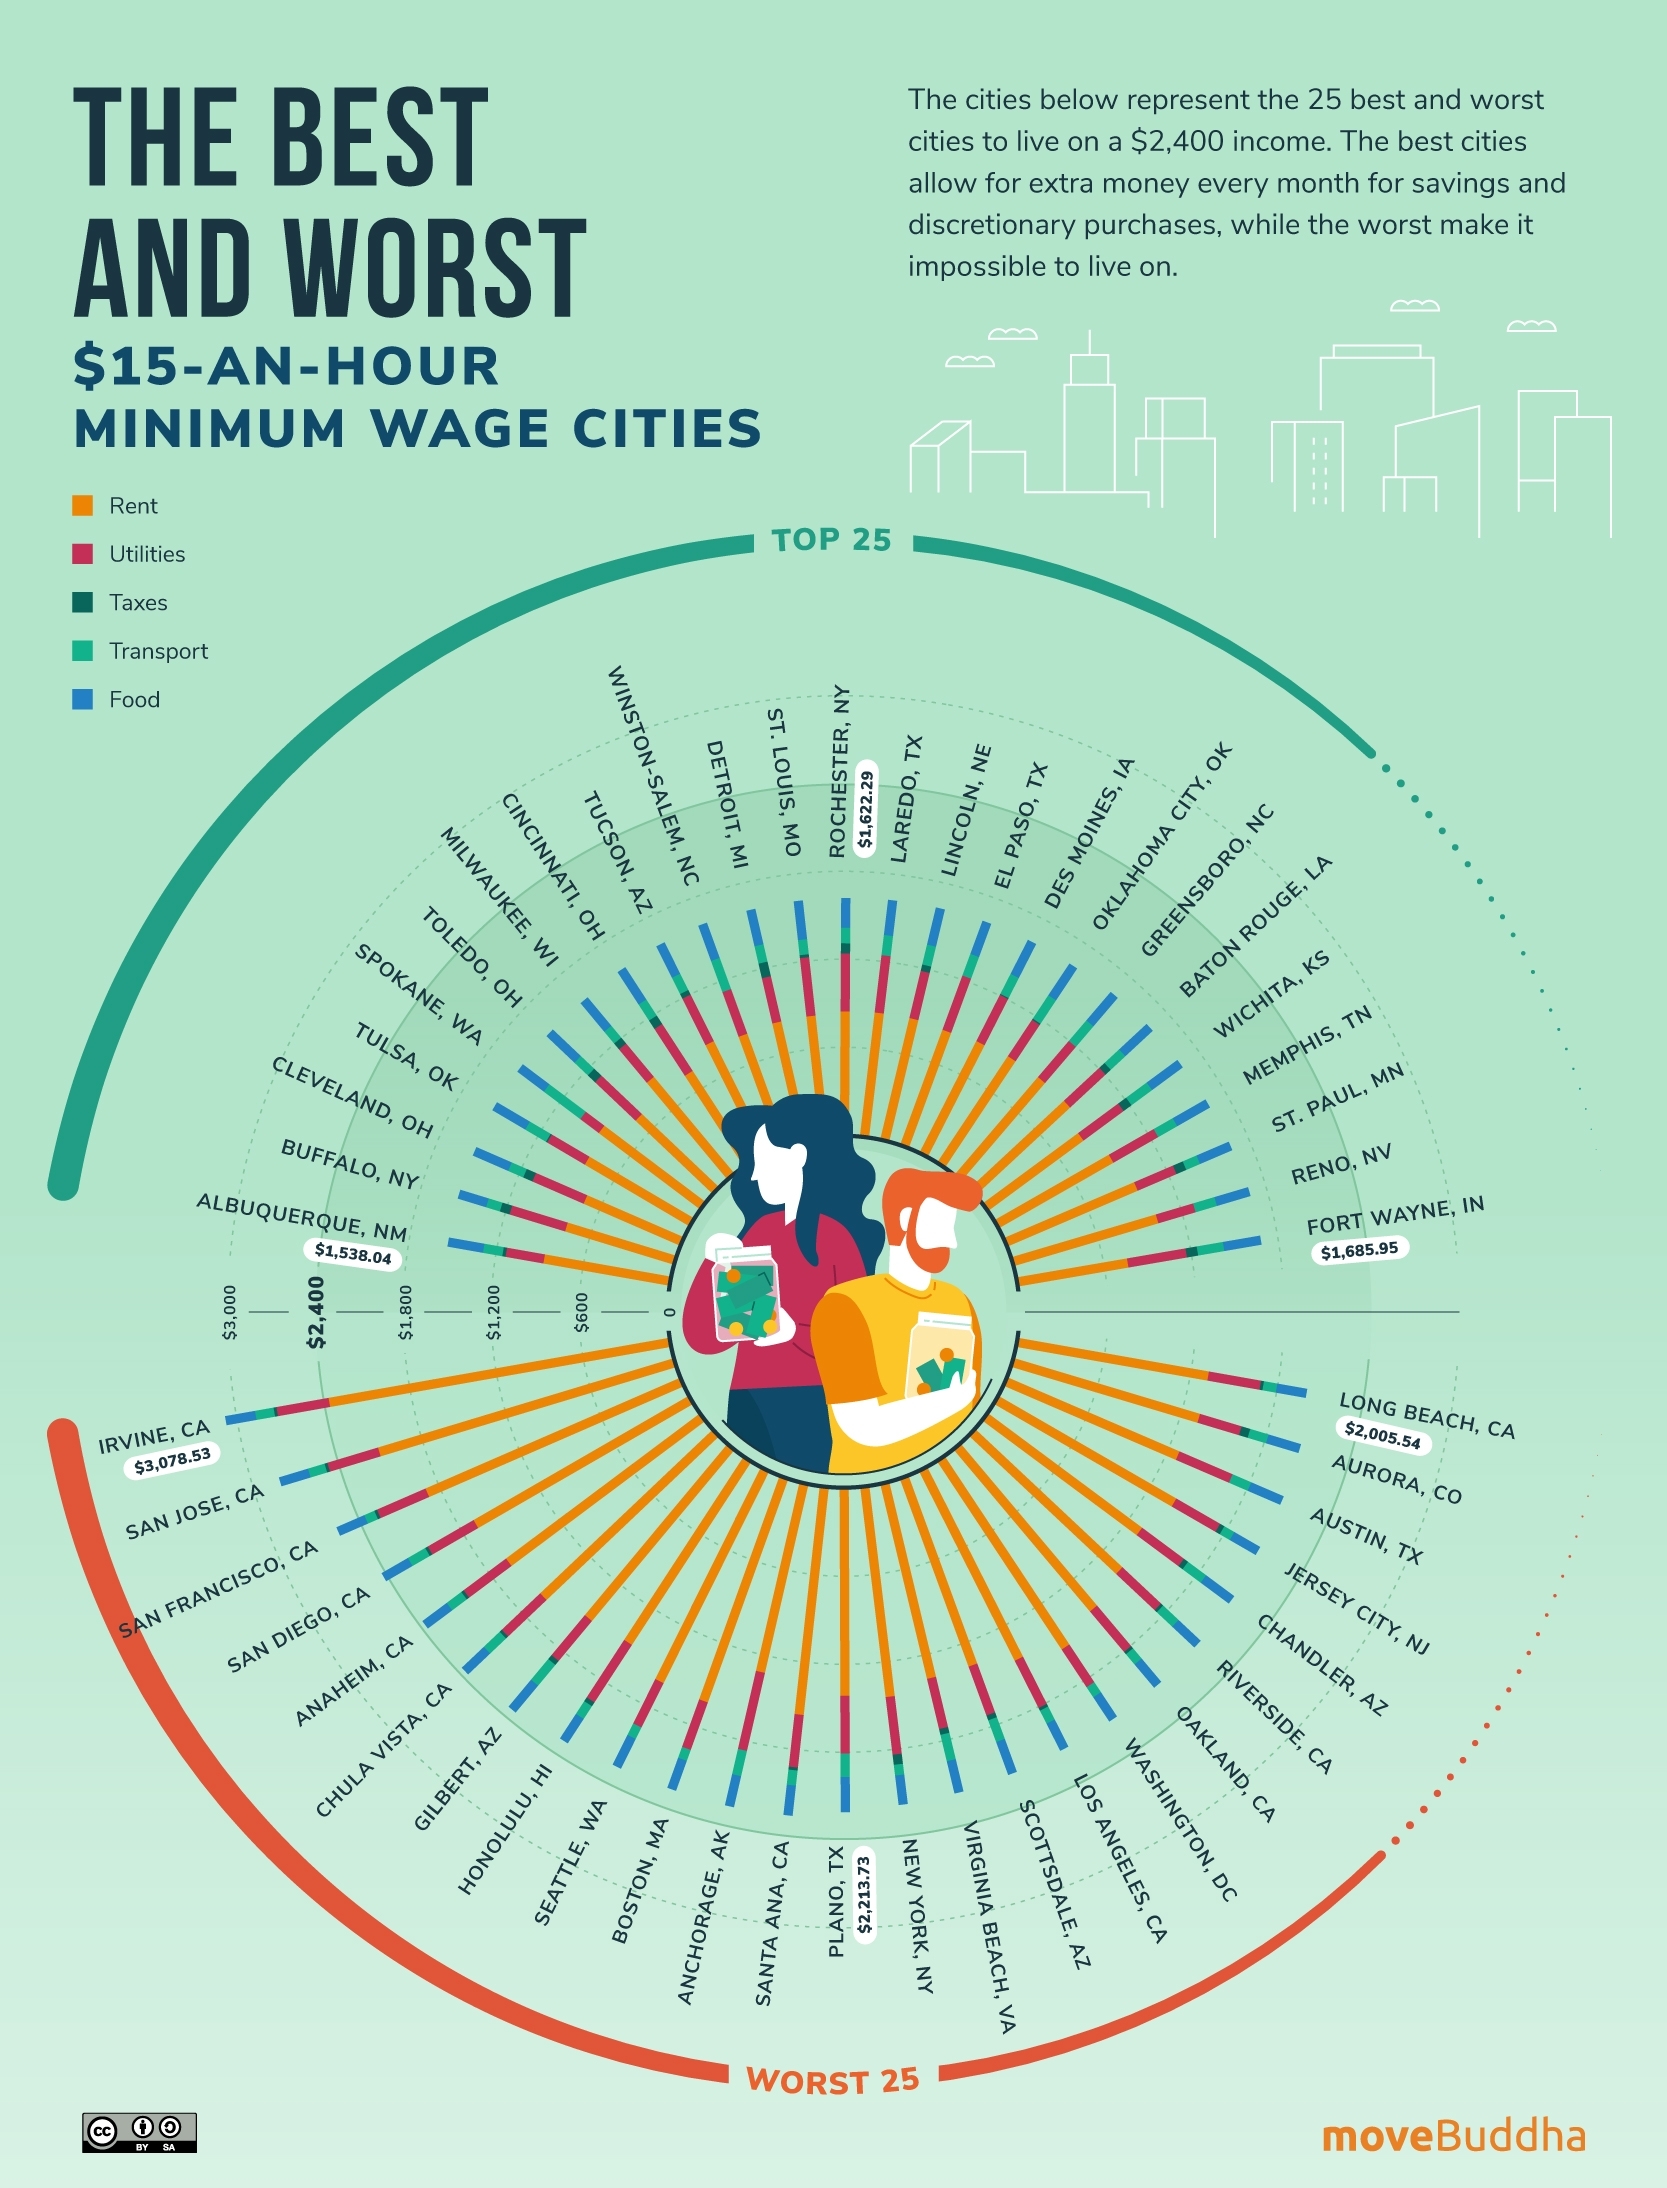
While a $15 federal minimum wage would certainly improve the lives of many low wage workers across the country, it simply isn’t enough to get by in many American cities. Here are 25 places where making ends meet at $15/hour would be incredibly difficult if not downright impossible.
Perhaps unsurprisingly, California is by far the most difficult place to live off $15/hour. 11 California cities rank in our bottom 25, and in four of them (Irvine, San Jose, San Francisco, San Diego), $2,400/month is literally not enough to cover the expenses laid out in our budget.
High rent prices are the main culprit when it comes to California’s poor conditions for low wage workers. For instance, the median rent in Irvine, CA is $2,361, which constitutes 98% of a month spent working for $15/hour. In order to follow the 30%-of-your-income-for-housing rule in Irvine, a worker would need to be making at least $49.19 an hour.
It is notable that many of the 25 most difficult cities in which to live on $15/hour are places where the state or local minimum wage is already much higher than the federal minimum.
In California, the statewide minimum wage is $14/hour, and San Francisco‘s local laws stipulate $16.32/hour. In New York City, the local minimum wage is already $15/hour. And in Seattle, WA, the minimum wage is $16.69.
In fact, among our 25 worst cities in the USA to live on just $15/hour, Plano, TX is the only location where the local minimum wage is equivalent to the federal minimum of $7.25/hour.
Methodology
Cities analyzed
Our analysis spanned 99 American cities, all of which have populations greater than 250k residents.
Income at $15/hour
In order to build a budget for a single, childless person working full-time at $15/hour, we started with a monthly income of $2,400 before taxes. This figure for monthly income accounts for someone who works 240 eight-hour days per year or 20 days per month on average. There are 261 working days per year in the U.S.A., so our figure includes 21 days annually for vacation and/or sick leave.
State Taxes
For each city, we subtracted the following figures to calculate the tax burden:
- Standard year deduction by state
- State income tax rates
Utility expenses
We used figures from this 2019 RentCafe study to calculate the monthly cost of utilities. Statewide averages were applied to each city in our analysis for:
- Electricity
- Gas
- Water
- Sewage
- Cable
- Internet (60 Mbps)
Rent
We used the median rental cost for each city as reported by 2019 estimates from the U.S. Census Bureau.
Food costs
A 2019 survey by the U.S. Department of Agriculture found that in 2019, the average American spent roughly
As a basis, we rounded this number to 10%. For each city, the baseline food budget started at $240 (10% of a $2,400 monthly income).
We then adjusted each local food budget according to the Big Mac Index, a metric developed by The Economist as an informal way of measuring the purchasing power parity and cost of consumer goods in different locations.
For instance, a Big Mac in Buffalo costs only 85% as much as the national average. So food costs in Buffalo were adjusted to $202.96. In Indianapolis on the other hand, a Big Mac costs 108% of the national average. The local food budget for Indianapolis was thus adjusted to $258.27.
Transportation costs
The average American household spends roughly
We then adjusted this 10% baseline figure based on the walkability, bike-ability, and public transit scores for each region as collected by Walk Score. For each factor, cities were scored on a scale of 0-1, with 0 being the best infrastructure for walking/biking/transit, and 1 being the worst.
The walking/biking/transit scores were then averaged together and used to adjust the 10% of monthly income ($240) figure. For instance, Jersey City has an aggregate transportation score of 0.33, bringing monthly transportation costs down to $78.52 (33% of $240) for the region. Arlington, TX, on the other hand, has an aggregate score of 0.94, which makes local transportation costs comparatively higher ($226.04 per month).
Final rankings
Final rankings were determined by the amount of cash a person with a $2,400 gross income would have leftover each month after paying all expenses detailed above.
Not what you were looking for?
Check out other categories that can help you find the information you need!
