Are People Moving to or Leaving San Francisco in 2023?
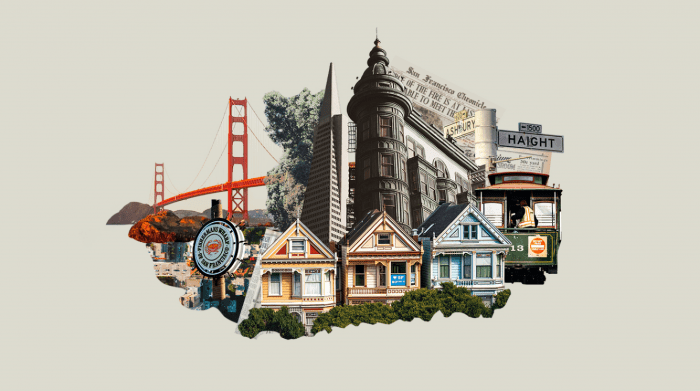
Are people leaving San Francisco? Or are people moving back to San Francisco now in 2023?
The question is as old as time – ever since San Francisco became an early boomtown in the 1800s. It’s maintained that boomtown status ever since.
In 2023 we’ve seen scores of people who fled the city during the pandemic to cities like Miami, New York, and Denver come back.
Quietly of course.
In 2022, when SaaS multiple depletions came crashing down to earth, hope was lost once again for San Francisco’s office tower workers. It was so over.
But then, the AI boom came roaring back. “Cerebral Valley” was the center of the AI hotbed of activity. Now it’s everywhere. The AI virus has now spread throughout the Bay Area.
It may be too early to call, but we’re saying in 2023, San Francisco is back. So back.
We have 2022 numbers below, that don’t paint the most rosy picture. But we’ve seen some interesting changes in 2023.
Big Takeaways
- Long COVID continues: While lockdowns have ended, the Bay Area’s pandemic pain remains. In 2022, 100 residents moved out of the Bay Area for every 63 newcomers — meaning nearly 2/3 of all searches for moves were outbound.
- Palo Alto is the big man on campus: Stanford’s high-income hometown is the most popular neighborhood in San Francisco. The zip code is of the few still attracting attention from movers with 2.23 times the in-moves as out-moves.
- Out of 140 Bay Area zip codes, only 7 are either holding steady or gaining residents.
- It’s not price or location: The Bay Area is losing residents from all income levels and regions.
- If you’re going to San Francisco, wear Buckeye leaves in your hair: Ohioans are most likely to move to the city by the Bay, while San Franciscans are most likely to head to Austin.
Mission Impossible?: The Bay Area’s Long Road Back from COVID-19
No strangers to disaster, San Franciscans have rebuilt their city before. In 1906, a major earthquake jolted the city’s foundations, destroying half its buildings, causing massive fires, and ultimately killing 3,000 people—at the time, less than one percent of the city’s total population.
The city was rebuilt. It steadily turned its legacy of gold pans into silicon chips and tech unicorns. By 2019, it was one of the most expensive areas in the U.S., awash in cash from a combination of venture capital, educational prowess, and hungry talent.
Then a second seismic catastrophe struck.
Shaken by a global pandemic, San Francisco racked up what amounted to more than 6 times the population loss of the famous earthquake. Few residents died, but the city saw 6.4% of its population call it quits between July 2020 and July 2021, more than any other metropolitan area in the country.
Recovery has been tough. There was public acknowledgment from figures like the mayor that the city’s bustling downtown wouldn’t come back. Even as recently as October 2022, almost a fifth of residents said they were planning to leave within the year. And a podcast called Fixing Our City felt like an admission that things weren’t so Golden in the Golden Gate City.
If it’s not coming back, where is San Francisco headed? What about the entire Bay Area?
We wanted to know if the region’s recovery was really so bleak, so we analyzed moveBuddha’s 2022’s data to find out if there are any areas on solid ground for 2023, and which are still feeling the aftershocks from 2020’s great shake-up.
Table of Contents:
I. San Francisco Timeline – Timeline of searches for moves
II. San Francisco Neighborhood Trends
III. Moving to and from San Francisco by major cities
IV. Moving to and from San Francisco by state
V. Methodology
I. Timeline of Moves to and from San Francisco: The Land of No Return
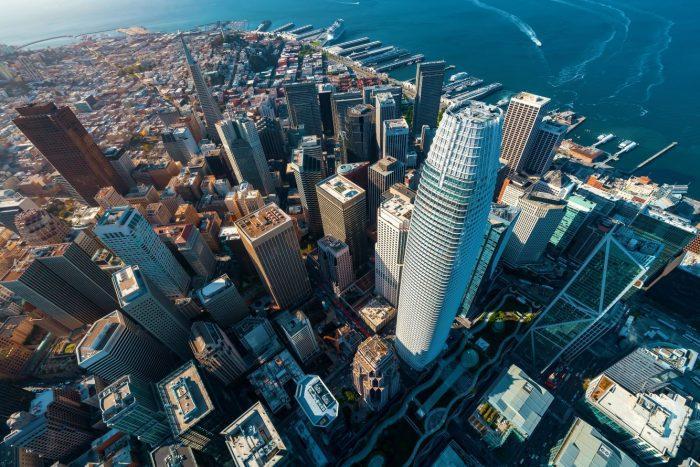
Even while boasting a rock-bottom death toll during the COVID-19 pandemic, San Francisco lost 2.8% more of its population than second-place New York, an early center of transmission. And that’s not counting San Jose, which shed 2.9% of its population.
This trend has continued well past the time of vaccination campaigns and return-to-office orders, suggesting that fear of a densely populated community isn’t the only thing residents are rejecting. In fact, residents cite crime as a top reason they plan to relocate, not COVID.
Today, more people are moving into San Francisco every month than were in January 2020. But that figure is misleading. With much more moving activity, more new residents are coming in, and more movers are heading out. The gap between in- and out-moves is more significant than the number of total moves.
San Francisco isn’t significantly narrowing the distance between its out-moves and in-moves. That keeps the population falling steadily regardless of the velocity of overall moves.
In reality, people aren’t coming back to the Bay Area.
For all of 2022, San Francisco’s in- to out-move ratio averaged .63, meaning for every 63 people moving into San Francisco, 100 were moving out. In 2021, that average was .58. San Francisco is barely closing the gap. And while it’s losing fewer people than it was in 2021, the city has a long way to go before it sees a net increase in residents.
Notice that in January 2020, the Bay Area was losing residents. Still, its in-to-out ratio was .83. Though 100 residents left the area for every 83 entering, that ratio was less lopsided. The pandemic accelerated the trend toward out-moves, and it isn’t letting up yet.
II. San Francisco Moving Trends
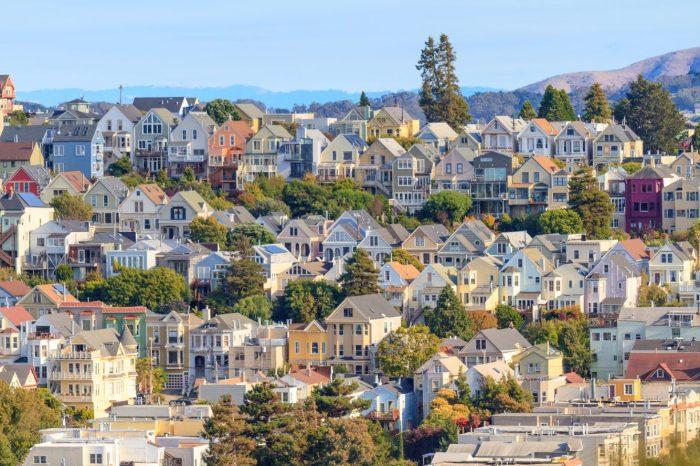
While the overall trend in the Bay Area is for more out-moves than in, a select few neighborhoods are winning new residents. Which ones?
Analyzing moveBuddha search data, we found which zip codes have the highest proportion of moves out vs in, and the inverse. Only zip codes with 25 moves in and out were considered for this analysis (104 zip codes). Of the 104 of zip codes we analyzed, just 6—the top 5 plus one neighborhood in Sunnyvale—have a positive in-to-out ratio (Shout out to 94102, the area around San Francisco City Hall, for breaking even).
Silicon Islands in a Regional Sea of Move-Outs
Today, incoming San Franciscans move to small, desirable neighborhoods throughout the region.
While other cities saw their socially-distanced outlying areas grow, San Francisco saw move-outs from most areas, both inner-city and suburban. The Bay Area even maintained its most desirable neighborhoods along the urban Silicon Valley corridor between San Francisco and San José.
Large outflows came not only from the dense city neighborhoods but from areas in the North San Joaquin Valley, East Bay, and Sacramento areas. The region’s largest losers include what might look like attractive outposts in a pandemic. However, the pattern suggests that Northern Californians aren’t looking for a home base from which to hit the office once per pay period and snag some backyard space.
Instead, new residents want all the vibrancy of fly fishing in the park, grabbing some dim sum, and escaping to Mile Rock Beach for an afternoon of rock-stacking. They also want safe neighborhoods and proximity to work.
Top zips to move to in SFX:
| Zip | City | 2022 In-to-out Ratio |
| 94301 | Palo Alto | 2.23 |
| 95131 | San Jose | 1.31 |
| 94103 | San Francisco | 1.26 |
| 94040 | Mountain View | 1.06 |
| 94014 | Daly City | 1.06 |
Palo Alto’s 94301 zip code is the only regional zip code where more than twice as many newcomers are moving in as they are heading out.
It’s no wonder. Palo Alto was voted the top neighborhood in California. Abutting the east side of Stanford’s campus, the academic neighborhood residents are more likely to have an advanced degree than not. Both city high schools vie for top spots on lists of California’s highest-achieving public schools, and cultural opportunities that percolate from having an academic powerhouse in your backyard abound.
It all makes residents happy to stay while others in the region plan their exits. And those looking to settle in Silicon Valley see an island of growth in an otherwise shrinking region.
In San Francisco, movers head to South of Market (SoMa), a former warehouse district that mimics its popular neighbors to the south as a center for tech startup offices. Twitter, Pinterest, Dropbox, Cloudflare, and Salesforce make their homes here, alongside bars, museums, and galleries.
It’s right next door to the North-of-Market Civic Center neighborhood holding its own, with just as many move-ins as move-outs. Maybe that’s because it’s close to Pug Sunday and some of the best brunch places in town. These center-city winners offer residents the buzz that many still crave.
Additionally, specks of hope glimmer in Daly City and central San José, showing that there are prize neighborhoods across the Bay Area attracting new moves, even while the majority of zip codes are experiencing outflow.
Maybe it’s the Microclimate: Popular Neighborhoods Span Price and Geography
Desirability always comes with a price tag, and the Bay Area’s winning neighborhoods are no different. The popular zip codes all cost new renters more than the Bay Area’s $3,126 average rent.
Land of coastal redwoods and a charming farmer’s market, you’ll pay more to rent a home in Palo Alto, with median rents topping $5,000 monthly, second overall in the Bay Area. Renting here will cost newcomers 39% more than even the regional average.
But don’t lose hope: other zip codes that attract new movers don’t come with the same sticker shock. The second-priciest zip code, in nearby Mountain View, gets movers a Silicon Valley address that costs just 12% above the area norm.
While that might seem reasonable, new residents can expect to pay more here than in almost any other metro in the country. It’s a longstanding reason why many relocate out of the Bay Area. So unless they’re moving from New York or Boston, newcomers will likely feel a pain in their wallet as they migrate to a “bargain” neighborhood.
While housing affordability is a well-known problem for San Francisco’s new residents, buyers will find more deals in top zip codes than renters. The median sale price in the Bay Area is $1,399,417, so 3 desirable zip codes entice buyers with below-average prices: SoMa’s 94103, Daly City’s 94014, and north-central San José’s 95131.
Daly City’s easy commuting and familiar fog appeals to residents looking for more space and better prices, with less crime, than the central city. Northern San José newcomers escape the fog but find an equally urban atmosphere in a city touted for its urban villages and distinct approach to making city life less car-dependent. It makes sense that both would appeal to newcomers looking for updated metropolitan living, with all the Bay Area's positives and fewer problems.
Exits Abound
San Francisco may have lost many of its high-income earners, but 2022 moving data shows that the zip codes shedding the most residents today aren’t just those with the highest prices.
| Zip | City | 2022 In-to-out Ratio |
| 94553 | Martinez | 0.35 |
| 94404 | San Mateo | 0.34 |
| 94555 | Fremont | 0.33 |
| 94928 | Rohnert Park | 0.27 |
| 94123 | San Francisco | 0.26 |
In fact, the biggest-losing zip codes of 2022 span some of the region’s highest (like Foster City, where the median rent is $3,670) to those near the bottom (such as Rohnert Park, where you’ll pay $2410 monthly).
Home values also tell a mixed story, with zip codes above and below the area average represented among movers.
The zip codes losing the most residents don’t have high or low prices in common. They don’t even share a common geography: Rohnert Park lies across the Golden Gate Bridge near Santa Rose, while Martinez is in the East Bay, and the Marina District/Cow Hollow is right downtown.
Several Sunnyvale zip codes top the move-out list, while another comes in sixth, one of just a handful of zip codes where newcomers outnumber movers.
Downtown San Francisco also gets mixed reviews from movers, with several zip codes near the top of movers’ lists and others at the bottom.
What gives?
Pandemic-era research showed both high earners and young professionals leaving the city. At the same time, a rich and varied economy kept some professionals heading in, no matter what their geographic sensibilities. That has made several unique neighborhoods appealing to multiple demographics, including those wanting large, safe homes and those checking out up-and-coming studios.
The diversity of the Bay Area shines through in its movers. But one pattern stands out: San Franciscans didn’t go with the COVID flow. They rejected suburban sprawl, sticking close to corridors where jobs, education, and culture abound.
III. Which Cities are Moving to and from San Francisco?
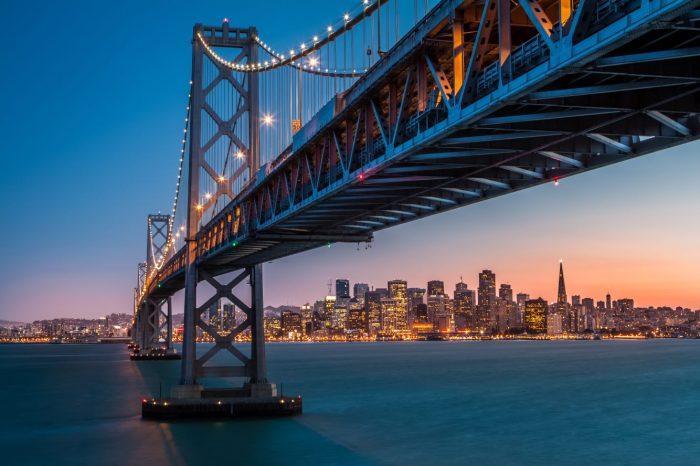
Which cities sent more people to San Francisco than vice versa? In 2022, there were just 6: Pittsburgh, Philadelphia, Columbus, OH, Richmond, Atlanta, and Irvine.
The top three boast strong tech labor pools and educational hubs where well-known universities might feed an industry on the prowl for new talent.
Pittsburgh, home to Carnegie-Mellon university, has been named a top emerging startup ecosystem on its own. Praised for robotics and showing off its own unicorn, Duolingo, Steel City workers might find they’re in demand as San Francisco companies recruit nationally. Fellow Keystone staters from Philadelphia might graduate from UPenn and look for the same opportunities.
Similarly, Columbus enjoys major university research ties, winning nods from major Bay Area players. For example, Intel picked the city for two new chip factories. Meta and Google targeted it for new data centers. Grads with tech aspirations might find they’re dreaming about relocating to corporate headquarters.
Now where are those leaving San Francisco Bay Area heading the most?
- Austin, Texas
- Las Vegas, Nevada
- Reno, Nevada
- Miami, Florida
- Orlando, Florida
Sick of the fog, and perhaps following tech giants who left the Bay Area, San Franciscans headed to Austin, Texas in swarms in 2022.
Tesla, Google, and Oracle did it.
It’s only logical that their employees also make the leap to Silicon Hills. After all, Bay Area residents and the companies that employed them struggled with some of the same issues solved by the same move destinations.
First, they paid a lot to live in Silicon Valley. That made labor costs high and deterred new talent from accepting offers. Second, high taxes felt suffocating. Third, quality of life was slipping amidst both crime and affordability constraints.
With no personal income tax and fewer regulations, Texas lured 40 California companies away between 2020 and 2022. California residents now make up 23% of moves to the state.
Las Vegas and Reno offer close-to-home variations on the same theme. Making a run for the border, Californians were able to reduce taxes, cast off high housing costs, and do business for less. They could also make it back more often for Giants’ games.
IV. Which States are Moving to and from San Francisco Most?
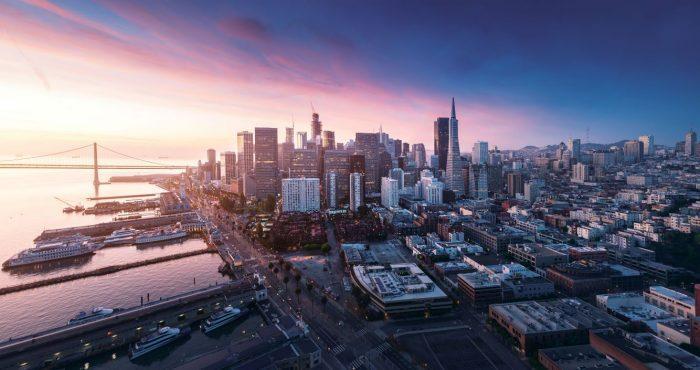
We looked at people moving from each state into Bay Area zip codes and subtracted those moving from Bay Area zip codes to the same state. This gave us the net moves of the Bay Area by state.
Of all net moves into and out of the Bay Area due to out-of-state moves, 95.4% of movers are exiting the city and 4.6% are moving in.
| OF net moves into and out of SF Bay Area | |
| Moves OUT of the Bay Area to other states | 95.4% |
| Moves IN to the Bay Area from other states | 4.6% |
Here are the states that SFC residents are moving to and from the most:
With massive losses to Texas, Florida, and other Western states, it’s hard to see the Bay Area’s in-migration at all. The story of California’s 2022 moves isn’t the states where Californians are heading. It’s how many are still going.
Who’s moving into the Bay Area? With California’s popularity destroyed, it’s the states that are unpopular for in-moves themselves.
Midwesterners are most likely to move to the Bay Area, with Ohio leading the way, and Michigan, Pennsylvania, and Indiana all in the top 5.
Ohioans are heading to the Bay Area, where they might contribute to an established tech industry or at least ditch their snowblowers. The Bay Area’s megaregion accounts for 5% of the country’s GDP, and while its residents are dwindling, Ohioans have been used to that story for decades. Generations, even.
The massive job and industry opportunities available in one of the biggest economies in the world continue to hold appeal in a region that still remembers its part in an industrial national success story, and knows the popularity of a place does not reflect its ability to offer up greatness.
The Bay of the Future
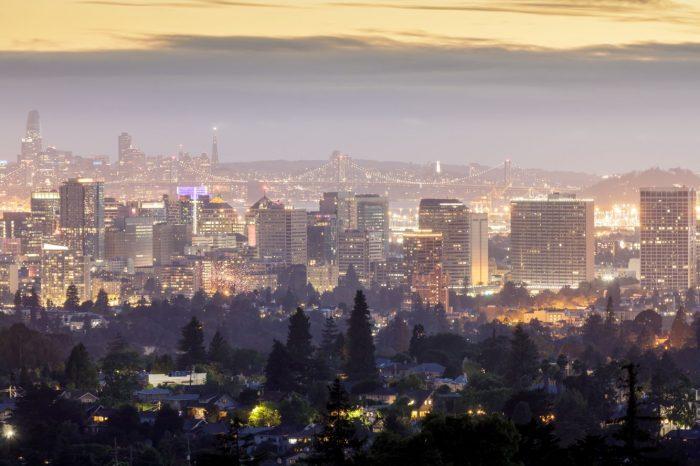
California’s popularity was waning before the pandemic.
That trend sped forward during 2021 and 2021, but has barely put on the brakes in 2022.
Remote work may be to blame, since it let workers walk away from their unaffordable homes, crime concerns, and sky-high taxes. When workers early in the pandemic weren’t tied to their expensive apartments, they went looking for open spaces, cavernous rooms, and a cheaper cost of living.
But in 2022, newcomers to the Bay Area don’t have the same ideals. They’re moving to large and small residences across the price spectrum and the region's most vibrant neighborhoods, not the sleepy hamlets far off the beaten track.
Whether they come from Ohio or Texas, they are most likely to move to urban spaces where they can enjoy a Stanford lecture or an exhibition at the San Francisco Museum of Modern Art. they also want to live close to the city, in safer, culturally rich, densely populated neighborhoods near exciting jobs.
These are some of the enclaves that have fared best in 2022, as newcomers seek out the gems of the Bay Area, and a lifestyle similar to the one that once attacted beats and hippies, dreamers and entrepreneurs.
The “new” San Francisco isn't so new. It may look a little like Austin.
As the Bay Area continues to find ways to recover, and move-outs continue at a slightly lower rate, the region has a chance to reimagine itself as a new kind of cultural beacon, meeting newcomers where they want to be and committing to helping them stay and thrive.
Sure, the quaking of 2022 opened up some new cracks and widened some that were already there.
But the Bay Area has already proven it can reinvent itself after a disaster. Its success will depend on how well it can offer up a safe, affordable city where new residents have a shot at building their own dreams.
Methodology and Sources
Data used in this report spans from January 2020 through December 31, 2022, capturing searches by individuals who were either planning to move themselves or hire a moving company in the subsequent year.
We used this data to analyze:
Section I: Timeline of moves in and out of San Francisco
- Moves into Bay Area zip codes
- Moves out of Bay Area zip codes
- Mover search data collected from Jan 1, 2020 through December 31, 2022, by zip code.
Section II: San Francisco Moving Trends
- The in-to-out ratio is calculated by dividing the number of searches for moves in by the number of searches for moves out.
- 2022 mover search data collected from Jan 1, 2022 through December 31, 2022, by zip code.
- Zillow Home Value Index and Observed Rent Index data.
Section III: Which U.S. Cities are Moving to and from San Francisco ?
- The in-to-out ratio by city is calculated by dividing the number of searches for moves into the Bay Area from a city by the number of searches for moves out of the Bay Area to the same city.
- Cities included in this analysis had a minimum of 25 searches for moves into the Bay Area and 25 searches for moves exiting the Bay Area to the same city in 2022.
- Mover search data collected from Jan 1, 2020 through December 31, 2022.
Section IV: Which States are Moving to and from San Francisco Most?
- Net inflow into the Bay Area by state: The number of searches for moves from a state into a Bay Area zip code subtracted by those moving from Bay Area zip codes to the same state.
- This excludes moves from the Bay Area to other parts of the state, and the reverse.
- 2022 mover search data collected from Jan 1, 2022 through December 31, 2022, by zip code.
Not what you were looking for?
Check out other categories that can help you find the information you need!

