America’s Best (and Worst) Cities for Graphic Designers
From employment rates, to median wages, to the cost of living – you may be surprised to learn which American cities offer the best and worst conditions for a career in Graphic Design.
Graphic design is a growing and versatile field of employment. Especially in this digital age, the graphic design profession is characterized by flexibility and limitless possibilities for specialization.
Creative and project-centered, graphic design is a natural choice for those seeking a cordless, freelance career path. Indeed, in 2019 more than a fifth of all graphic designers in the U.S. were self-employed.
But those seeking the stability of a full-time job also have a wide range of options with graphic design. Just about every company needs at least one graphic designer, and graphic design agencies abound.
Given the flexibility and versatility of graphic design, it may be surprising to learn there are better and worse places to be located to progress your career. Whether you are looking to score a major contract as a freelance designer, or seeking a full-time in-house or agency role, rates of employment and compensation vary tremendously by region.
If you are considering what relocating might be able to do for your career in graphic design, this article is for you. We gathered data from the Bureau of Labor Statistics, the Census Bureau, and the Bureau of Economic Analysis to paint a picture of the cities where graphic designers have the best and worst chances of finding gainful employment in their field.
Already planning a move to a city that appreciates graphic designers? Use this instant moving quote calculator to get an idea of the cost of your move.
Quick overview:
- Metrics & Methodology
- The Best & Worst Cities for Graphic Designers by Rates of Employment
- The Best & Worst Cities for Graphic Designers by Median Income
- The Best & Worst Cities for Graphic Designers by Spending Power
Metrics and methodology: How we determined the best and worst cities for graphic designers
Our analysis of the best and worst cities for a career in graphic design is based on primary data reported by three federal research bureaus in 2019.
- All graphic design employment data is from the Bureau of Labor Statistics and was collected during May 2019.
- All population data is based on 2019 estimates from the Census Bureau.
- All data about 2019 spending power (regional price parities) is from the Bureau for Economic Analysis.
- All figures in this piece are based on surveys of the relevant metropolitan statistical area as a whole.
Here are the metrics we looked at when assessing the favorability of a particular metropolitan area for a career in graphic design:
Location quotient
The location quotient can be used to understand the likelihood that a graphic designer will find employment in any given metropolitan area. As a statistic, the location quotient is the concentration of employed graphic designers in a particular area compared with the national average.
A location quotient greater than one indicates graphic designers comprise a higher share of employed people in this area compared to the nation as a whole. A location quotient less than one indicates that employed graphic designers are less prevalent in this area than average.
Population
Larger cities have larger economies than smaller cities. In order to avoid comparing apples with oranges, we break cities into four different categories and analyze them within this schema.
- Major cities are metropolitan areas with upwards of 2 million residents.
- Large cities are metropolitan areas with between 750,000 and 2 million residents.
- Mid-size cities are metropolitan areas with between 250,000 and 750,000 residents.
- Small cities are metropolitan areas with fewer than 250,000 residents.
Median hourly wage
Wages are one of the most important factors that people evaluate when choosing a job, and graphic designers are no exception. The median hourly wages for graphic designers reported in this piece come from a 2019 survey by the Bureau of Labor Statistics. The median hourly wage is defined as the paycheck in the 50th percentile of all wage data collected for that region, meaning 50% of graphic designers in this region make more money, and 50% make less.
Spending power: the real value of $100
Wages are important to consider when choosing a career, but so is the cost of living in your area. After all, $100 in San Francisco, California doesn’t go as far as $100 in Ames, Iowa.
Regional price parities are evaluated by the Bureau of Economic Analysis based on a number of differently-weighted cost-of-living factors including housing, food, transportation, and education.
According to this model, the real value of $100 in New York City is $79.55, meaning goods and services that cost a nationwide average of just $79.55 cost $100 in NYC. This would indicate a higher cost-of-living. By comparison, the real value of $100 in McAllen, TX is $121.65, meaning that a hundred dollar bill actually carries an additional $21.65 of spending power here than in the U.S. on average. This indicates a low cost-of-living for the region.
Hours worked for $100 spending power
Based on median hourly wages and the real value of $100 for each given region, we calculated how many hours a graphic designer would have to work in order to earn $100 of spending power in their city.
In which American cities are graphic designers most and least likely to find a job?
You might assume the largest metropolitan areas would offer the best opportunities for graphic designers. But this isn’t entirely true. While a number of major cities do have a workforce with a greater-than-average proportion of graphic designers, there are several small to mid-sized cities where graphic designers are much better represented among the working populace.
Small and mid-size cities like Oshkosh, WI and Provo, UT employ graphic designers at rates more than twice the national average, while a major metropolis like Houston, TX has a rate only 64% of the national average.
Whether you love the buzz of the big city or prefer a town with a slower pace, here are the best cities across America for graphic designers to find a job:
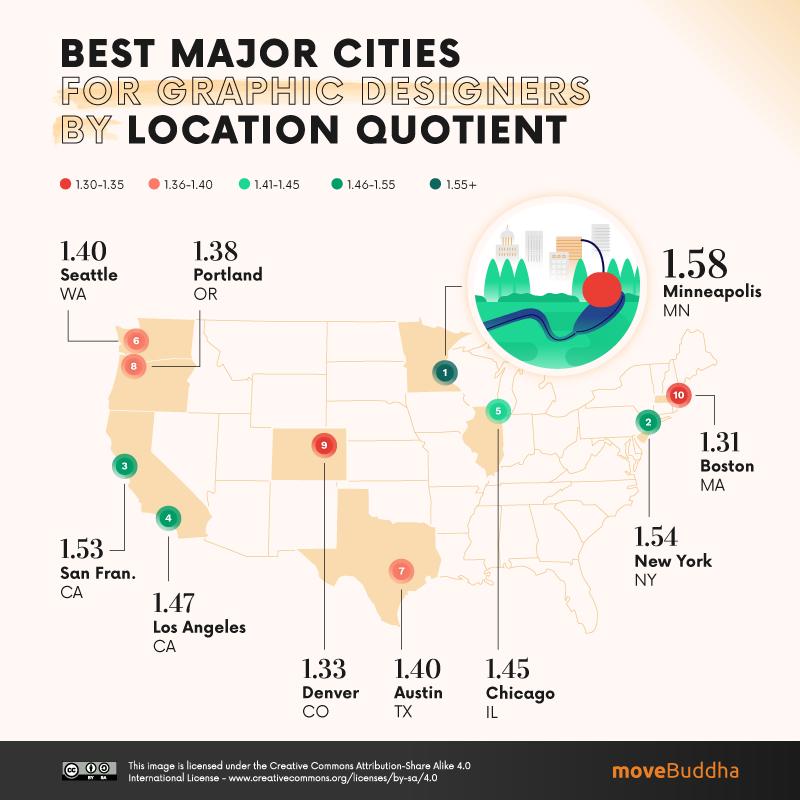
Best Major Cities for Graphic Designers by Location Quotient
| City | Location Quotient | Population 2019 | Real Value of $100 | Median Hourly Wage | |
| 1 | Minneapolis, MN | 1.58 | 3,640,043 | $ 97.18 | $25.50 |
| 2 | New York, NY | 1.54 | 19,216,182 | $ 79.55 | $30.62 |
| 3 | San Francisco, CA | 1.53 | 4,731,803 | $ 74.35 | $33.61 |
| 4 | Los Angeles, CA | 1.47 | 13,214,799 | $ 84.18 | $28.55 |
| 5 | Chicago, IL | 1.45 | 9,458,539 | $ 97.28 | $27.67 |
| 6 | Seattle, WA | 1.4 | 3,979,845 | $ 87.34 | $33.06 |
| 7 | Austin, TX | 1.4 | 2,227,083 | $ 100.70 | $25.50 |
| 8 | Portland, OR | 1.38 | 2,492,000 | $ 95.24 | $27.75 |
| 9 | Denver, CO | 1.33 | 2,967,239 | $ 95.97 | $27.24 |
| 10 | Boston, MA | 1.31 | 4,873,019 | $ 86.58 | $31.80 |
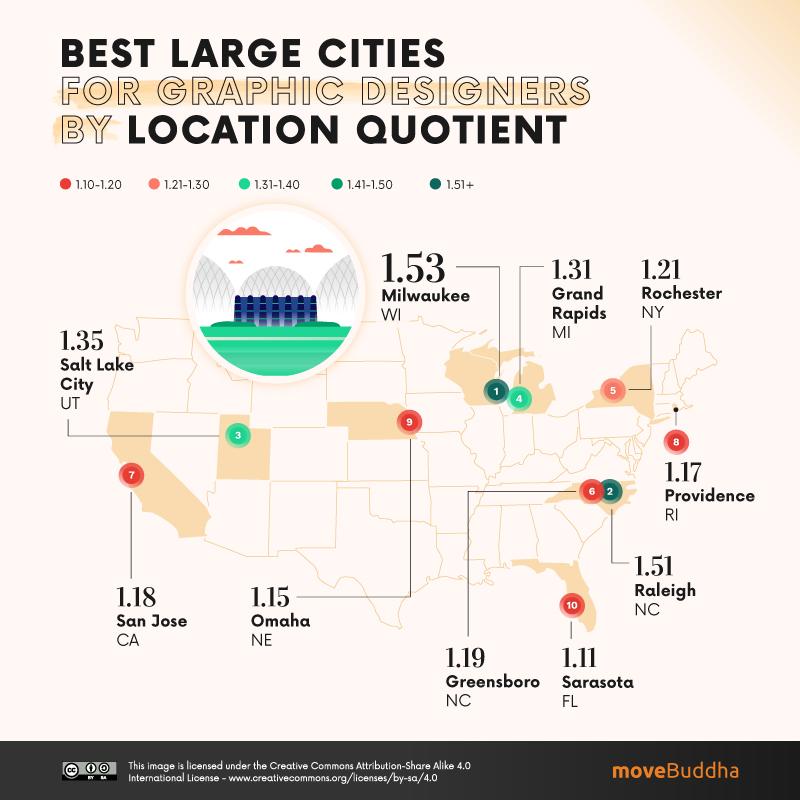
Best Large Cities for Graphic Designers by Location Quotient
| City | Location Quotient | Population 2019 | Real Value of $100 | Median Hourly Wage | |
| 1 | Milwaukee, WI | 1.53 | 1,575,179 | $ 105.71 | $24.22 |
| 2 | Raleigh, NC | 1.51 | 1,390,785 | $ 104.06 | $25.14 |
| 3 | Salt Lake City, UT | 1.35 | 1,232,696 | $ 101.42 | $23.44 |
| 4 | Grand Rapids, MI | 1.31 | 1,077,370 | $ 108.70 | $23.77 |
| 5 | Rochester, NY | 1.21 | 1,069,644 | $ 102.99 | $21.01 |
| 6 | Greensboro, NC | 1.19 | 771,851 | $ 111.11 | $21.94 |
| 7 | San Jose, CA | 1.18 | 1,990,660 | $ 78.93 | $32.35 |
| 8 | Providence, RI | 1.17 | 1,624,578 | $ 99.70 | $28.68 |
| 9 | Omaha, NE | 1.15 | 949,442 | $ 109.05 | $23.66 |
| 10 | Sarasota, FL | 1.11 | 836,995 | $ 99.21 | $21.03 |
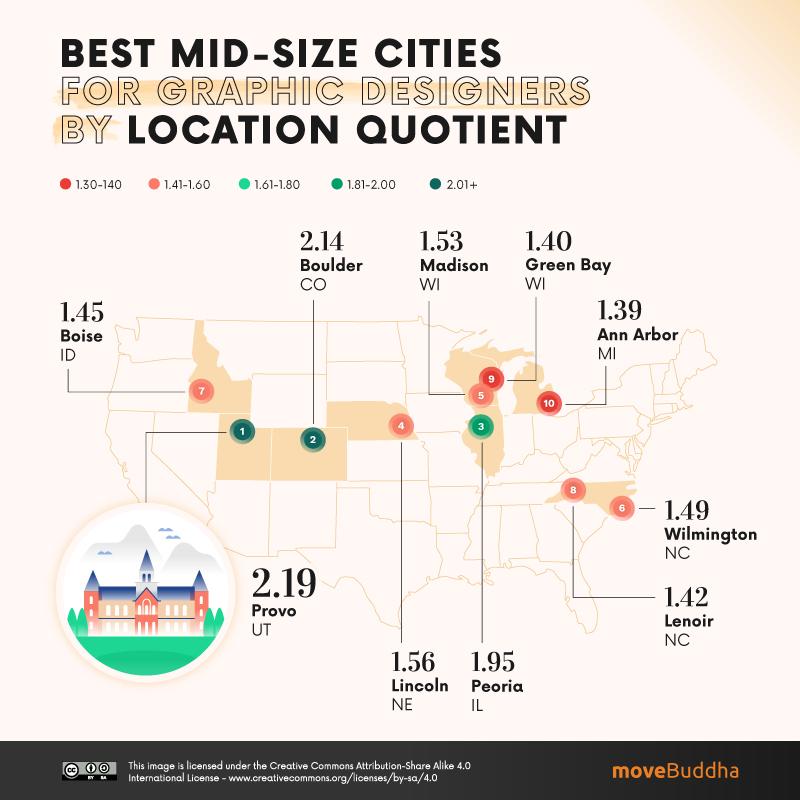
Best Mid-Size Cities for Graphic Designers by Location Quotient
| City | Location Quotient | Population 2019 | Real Value of $100 | Median Hourly Wage | |
| 1 | Provo, UT | 2.19 | 648,252 | $ 103.84 | $22.32 |
| 2 | Boulder, CO | 2.14 | 326,196 | $ 93.72 | $27.92 |
| 3 | Peoria, IL | 1.95 | 400,561 | $ 114.55 | $20.52 |
| 4 | Lincoln, NE | 1.56 | 336,374 | $ 110.01 | $20.81 |
| 5 | Madison, WI | 1.53 | 664,865 | $ 103.73 | $25.82 |
| 6 | Wilmington, NC | 1.49 | 297,533 | $ 105.93 | $20.50 |
| 7 | Boise, ID | 1.45 | 749,202 | $ 106.84 | $20.86 |
| 8 | Lenoir, NC | 1.42 | 369,711 | $ 114.42 | $17.14 |
| 9 | Green Bay, WI | 1.4 | 322,906 | $ 111.48 | $21.51 |
| 10 | Ann Arbor, MI | 1.39 | 367,601 | $ 99.40 | $24.62 |
Best Small Cities for Graphic Designers by Location Quotient
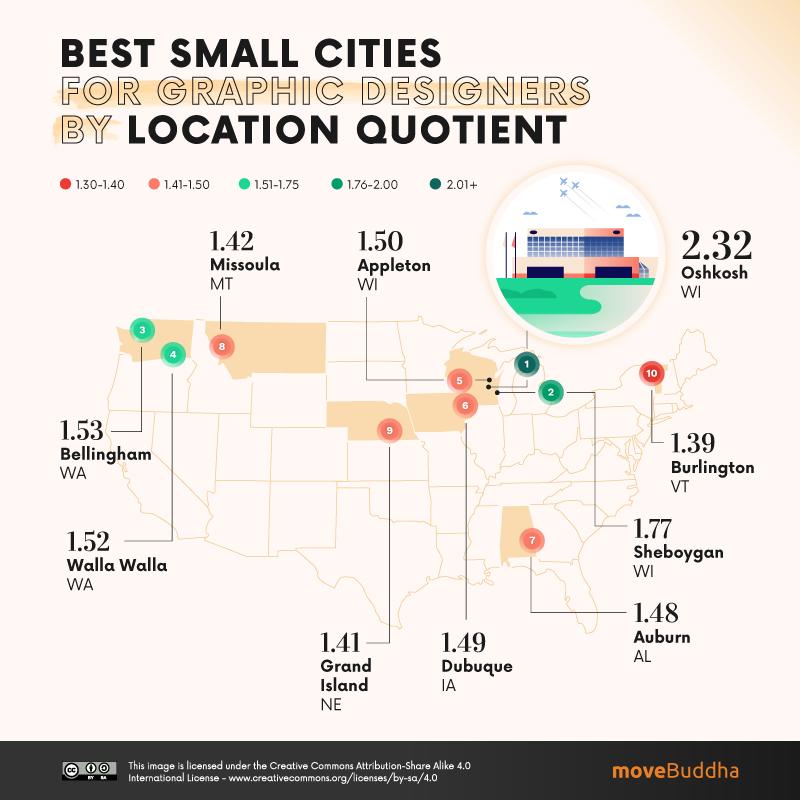
| City | Location Quotient | Population 2019 | Real Value of $100 | Median Hourly Wage | |
| 1 | Oshkosh, WI | 2.32 | 171,907 | $ 112.23 | $21.06 |
| 2 | Sheboygan, WI | 1.77 | 115,340 | $ 112.87 | $20.51 |
| 3 | Bellingham, WA | 1.53 | 229,247 | $ 98.43 | $21.88 |
| 4 | Walla Walla, WA | 1.52 | 60,760 | $ 102.88 | $29.87 |
| 5 | Appleton, WI | 1.5 | 237,974 | $ 112.49 | $18.56 |
| 6 | Dubuque, IA | 1.49 | 97,311 | $ 112.23 | $20.41 |
| 7 | Auburn, AL | 1.48 | 164,542 | $ 117.51 | $22.04 |
| 8 | Missoula, MT | 1.42 | 119,600 | $ 104.82 | $18.41 |
| 9 | Grand Island, NE | 1.41 | 75,553 | $ 116.96 | $21.81 |
| 10 | Burlington, VT | 1.39 | 220,411 | $ 94.16 | $22.64 |
Considering leaving your small town to pursue your graphic design career in a big city? Don’t assume that a larger population is necessarily indicative of better job opportunities. Here are the major and large cities in the United States with the lowest proportion of employed graphic designers.
Worst Major Cities for Graphic Designers by Location Quotient
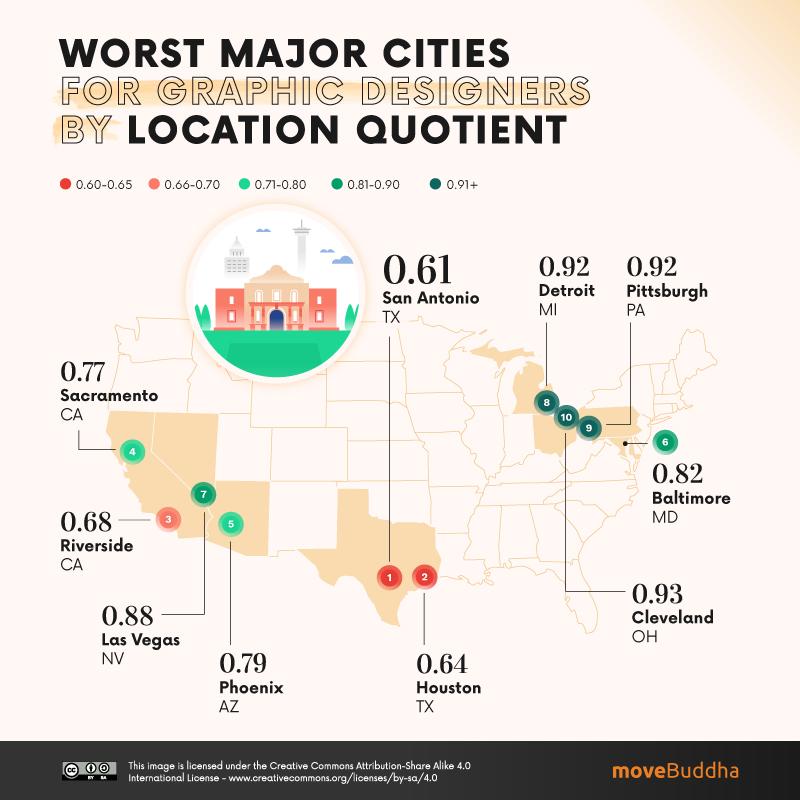
| City | Location Quotient | Population 2019 | Real Value of $100 | Median Hourly Wage | |
| 1 | San Antonio, TX | 0.61 | 2,550,960 | $ 107.18 | $25.52 |
| 2 | Houston, TX | 0.64 | 7,066,141 | $ 98.33 | $23.62 |
| 3 | Riverside, CA | 0.68 | 4,650,631 | $ 93.20 | $20.96 |
| 4 | Sacramento, CA | 0.77 | 2,363,730 | $ 95.06 | $26.93 |
| 5 | Phoenix, AZ | 0.79 | 4,948,203 | $ 101.32 | $24.21 |
| 6 | Baltimore, MD | 0.82 | 2,800,053 | $ 94.52 | $24.79 |
| 7 | Las Vegas, NV | 0.88 | 2,266,715 | $ 103.20 | $24.03 |
| 8 | Detroit, MI | 0.92 | 4,319,629 | $ 104.93 | $23.57 |
| 9 | Pittsburgh, PA | 0.92 | 2,317,600 | $ 108.23 | $25.83 |
| 10 | Cleveland, OH | 0.93 | 2,048,449 | $ 111.23 | $24.34 |
Worst Large Cities for Graphic Designers by Location Quotient
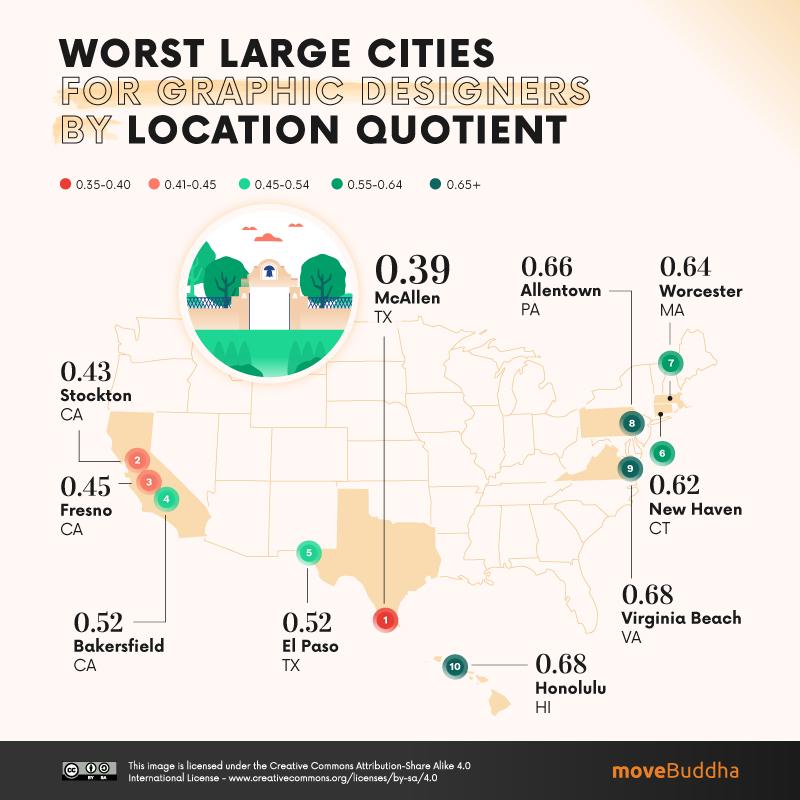
| City | Location Quotient | Population 2019 | Real Value of $100 | Median Hourly Wage | |
| 1 | McAllen, TX | 0.39 | 868,707 | $ 121.65 | $14.94 |
| 2 | Stockton, CA | 0.43 | 762,148 | $ 97.85 | $21.04 |
| 3 | Fresno, CA | 0.45 | 999,101 | $ 102.56 | $21.27 |
| 4 | Bakersfield, CA | 0.52 | 900,202 | $ 103.09 | $20.38 |
| 5 | El Paso, TX | 0.52 | 844,124 | $ 114.03 | $16.54 |
| 6 | New Haven, CT | 0.62 | 854,757 | $ 94.16 | $26.47 |
| 7 | Worcester, MA | 0.64 | 947,404 | $ 96.99 | $27.09 |
| 8 | Allentown, PA | 0.66 | 844,052 | $ 101.42 | $24.35 |
| 9 | Virginia Beach, VA | 0.68 | 1,768,901 | $ 103.73 | $24.74 |
| 10 | Honolulu, HI | 0.68 | 974,563 | $ 80.78 | $25.25 |
In which American cities do graphic designers earn the most?
How much are graphic design skills worth in different markets? The median hourly wage is a figure that can help you set expectations for how much you can earn as a graphic designer depending on your location.
Higher populations don’t always correlate with higher wages. For example, you may be surprised to learn that the median wage for graphic designers in Miami, FL is only 82% of that in Ithaca, NY.
Pick the city size best suited to you to see which regions in this population category offer the best wages for graphic designers:
Best Major Cities for Graphic Designers by Median Hourly Wage
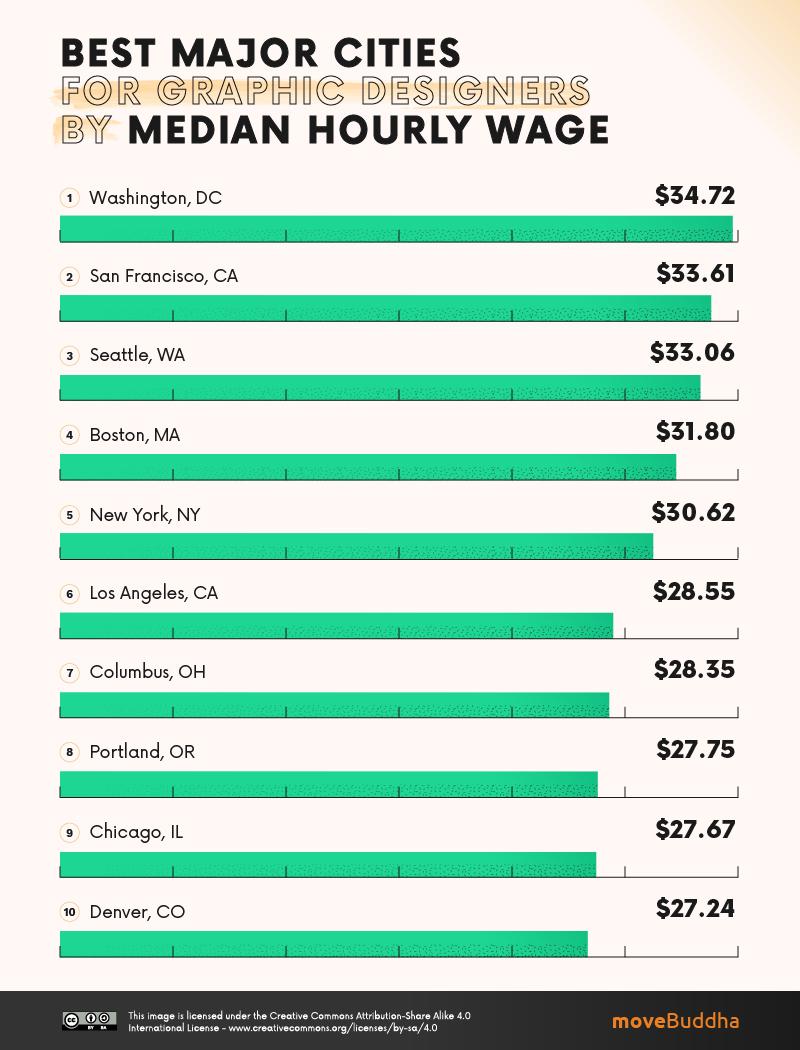
| City | Median Hourly Wage | Population 2019 | Real Value of $100 | Location Quotient | |
| 1 | Washington, DC | $34.72 | 6,280,487 | $ 85.18 | 1.07 |
| 2 | San Francisco, CA | $33.61 | 4,731,803 | $ 74.35 | 1.53 |
| 3 | Seattle, WA | $33.06 | 3,979,845 | $ 87.34 | 1.4 |
| 4 | Boston, MA | $31.80 | 4,873,019 | $ 86.58 | 1.31 |
| 5 | New York, NY | $30.62 | 19,216,182 | $ 79.55 | 1.54 |
| 6 | Los Angeles, CA | $28.55 | 13,214,799 | $ 84.18 | 1.47 |
| 7 | Columbus, OH | $28.35 | 2,122,271 | $ 109.17 | 0.99 |
| 8 | Portland, OR | $27.75 | 2,492,000 | $ 95.24 | 1.38 |
| 9 | Chicago, IL | $27.67 | 9,458,539 | $ 97.28 | 1.45 |
| 10 | Denver, CO | $27.24 | 2,967,239 | $ 95.97 | 1.33 |
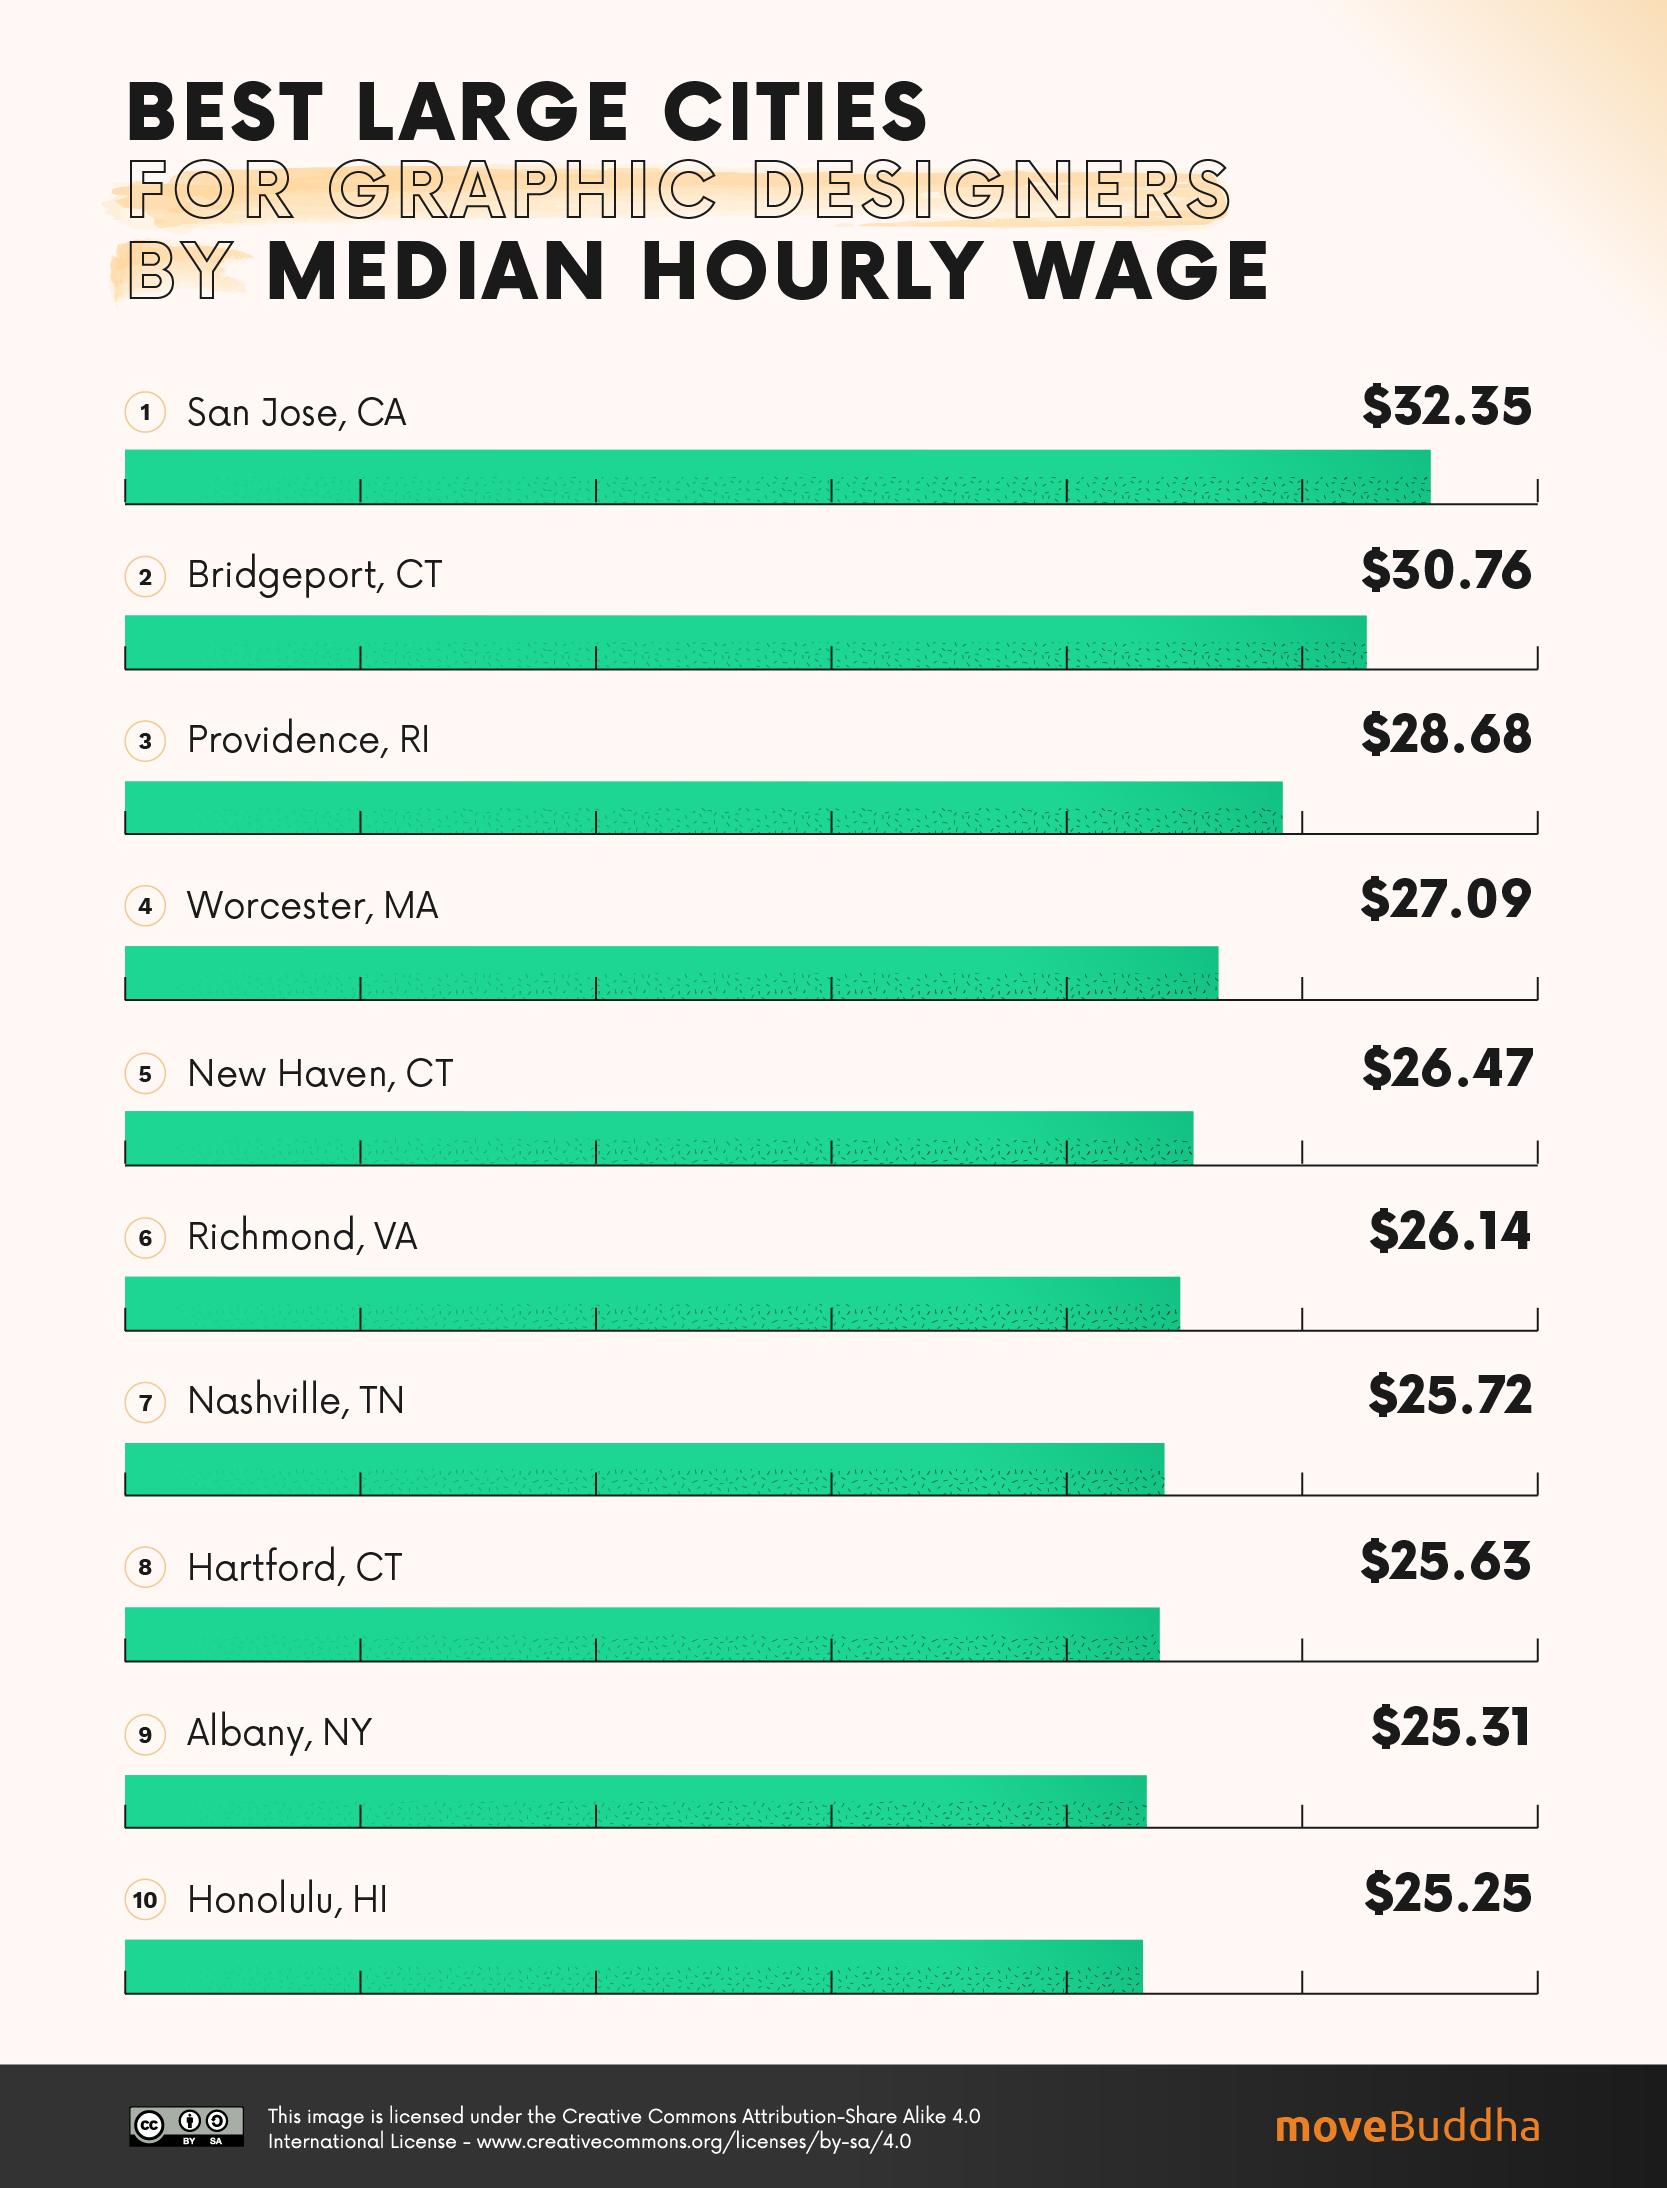
Best Large Cities for Graphic Designers by Median Hourly Wage
| City | Median Hourly Wage | Population 2019 | Real Value of $100 | Location Quotient | |
| 1 | San Jose, CA | $32.35 | 1,990,660 | $ 78.93 | 1.18 |
| 2 | Bridgeport, CT | $30.76 | 943,332 | $ 88.97 | 1.05 |
| 3 | Providence, RI | $28.68 | 1,624,578 | $ 99.70 | 1.17 |
| 4 | Worcester, MA | $27.09 | 947,404 | $ 96.99 | 0.64 |
| 5 | New Haven, CT | $26.47 | 854,757 | $ 94.16 | 0.62 |
| 6 | Richmond, VA | $26.14 | 1,291,900 | $ 104.38 | 0.92 |
| 7 | Nashville, TN | $25.72 | 1,934,317 | $ 105.93 | 0.97 |
| 8 | Hartford, CT | $25.63 | 1,204,877 | $ 97.56 | 0.91 |
| 9 | Albany, NY | $25.31 | 880,381 | $ 100.70 | 0.93 |
| 10 | Honolulu, HI | $25.25 | 974,563 | $ 80.78 | 0.68 |
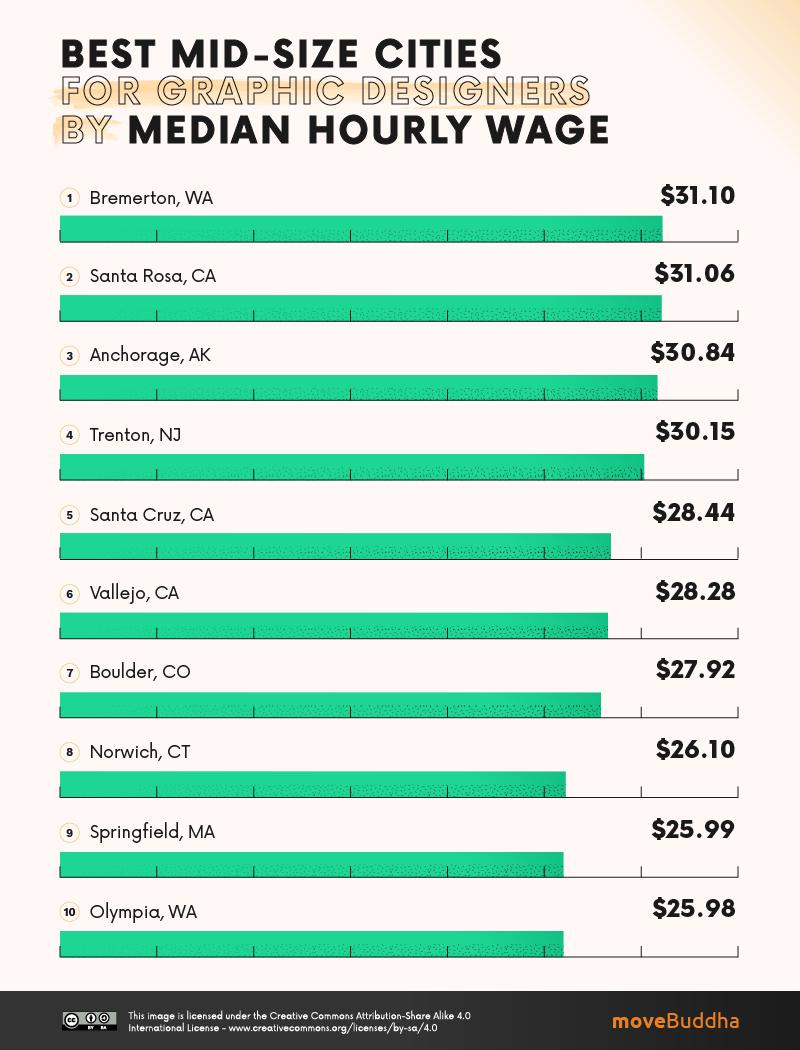
Best Mid-Size Cities for Graphic Designers by Median Hourly Wage
| City | Median Hourly Wage | Population 2019 | Real Value of $100 | Location Quotient | |
| 1 | Bremerton, WA | $31.10 | 271,473 | $ 92.00 | 0.41 |
| 2 | Santa Rosa, CA | $31.06 | 494,336 | $ 82.92 | 1.09 |
| 3 | Anchorage, AK | $30.84 | 396,317 | $ 93.81 | 0.61 |
| 4 | Trenton, NJ | $30.15 | 367,430 | $ 94.16 | 0.91 |
| 5 | Santa Cruz, CA | $28.44 | 273,213 | $ 81.50 | 1.04 |
| 6 | Vallejo, CA | $28.28 | 447,643 | $ 84.53 | 0.36 |
| 7 | Boulder, CO | $27.92 | 326,196 | $ 93.72 | 2.14 |
| 8 | Norwich, CT | $26.10 | 265,206 | $ 97.56 | 0.7 |
| 9 | Springfield, MA | $25.99 | 697,382 | $ 102.77 | 0.77 |
| 10 | Olympia, WA | $25.98 | 290,536 | $ 92.17 | 0.73 |
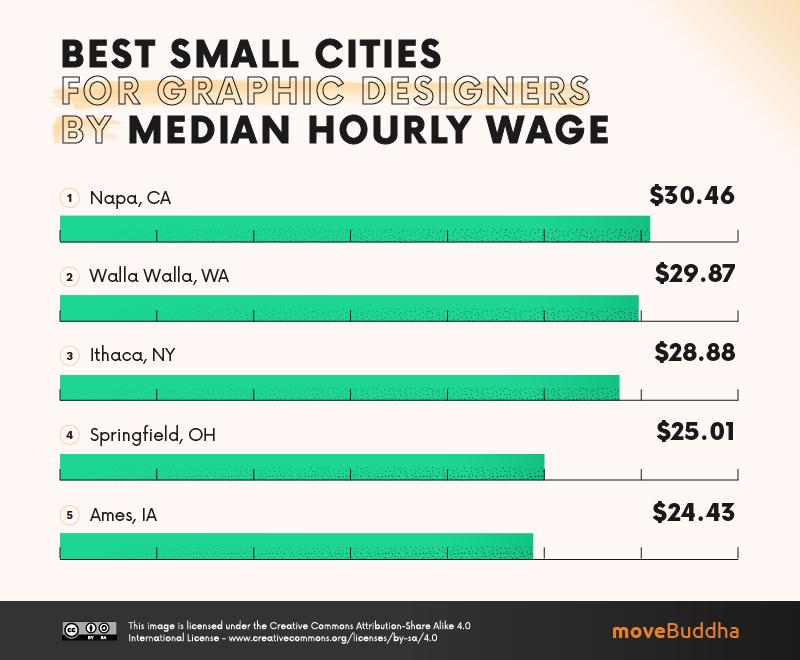
Best Small Cities for Graphic Designers by Median Hourly Wage
| City | Median Hourly Wage | Population 2019 | Real Value of $100 | Location Quotient | |
| 1 | Napa, CA | $30.46 | 137,744 | $ 82.78 | 1 |
| 2 | Walla Walla, WA | $29.87 | 60,760 | $ 102.88 | 1.52 |
| 3 | Ithaca, NY | $28.88 | 102,180 | $ 94.97 | 1.39 |
| 4 | Springfield, OH | $25.01 | 134,083 | $ 118.48 | 0.64 |
| 5 | Ames, IA | $24.43 | 123,351 | $ 108.93 | 1.39 |
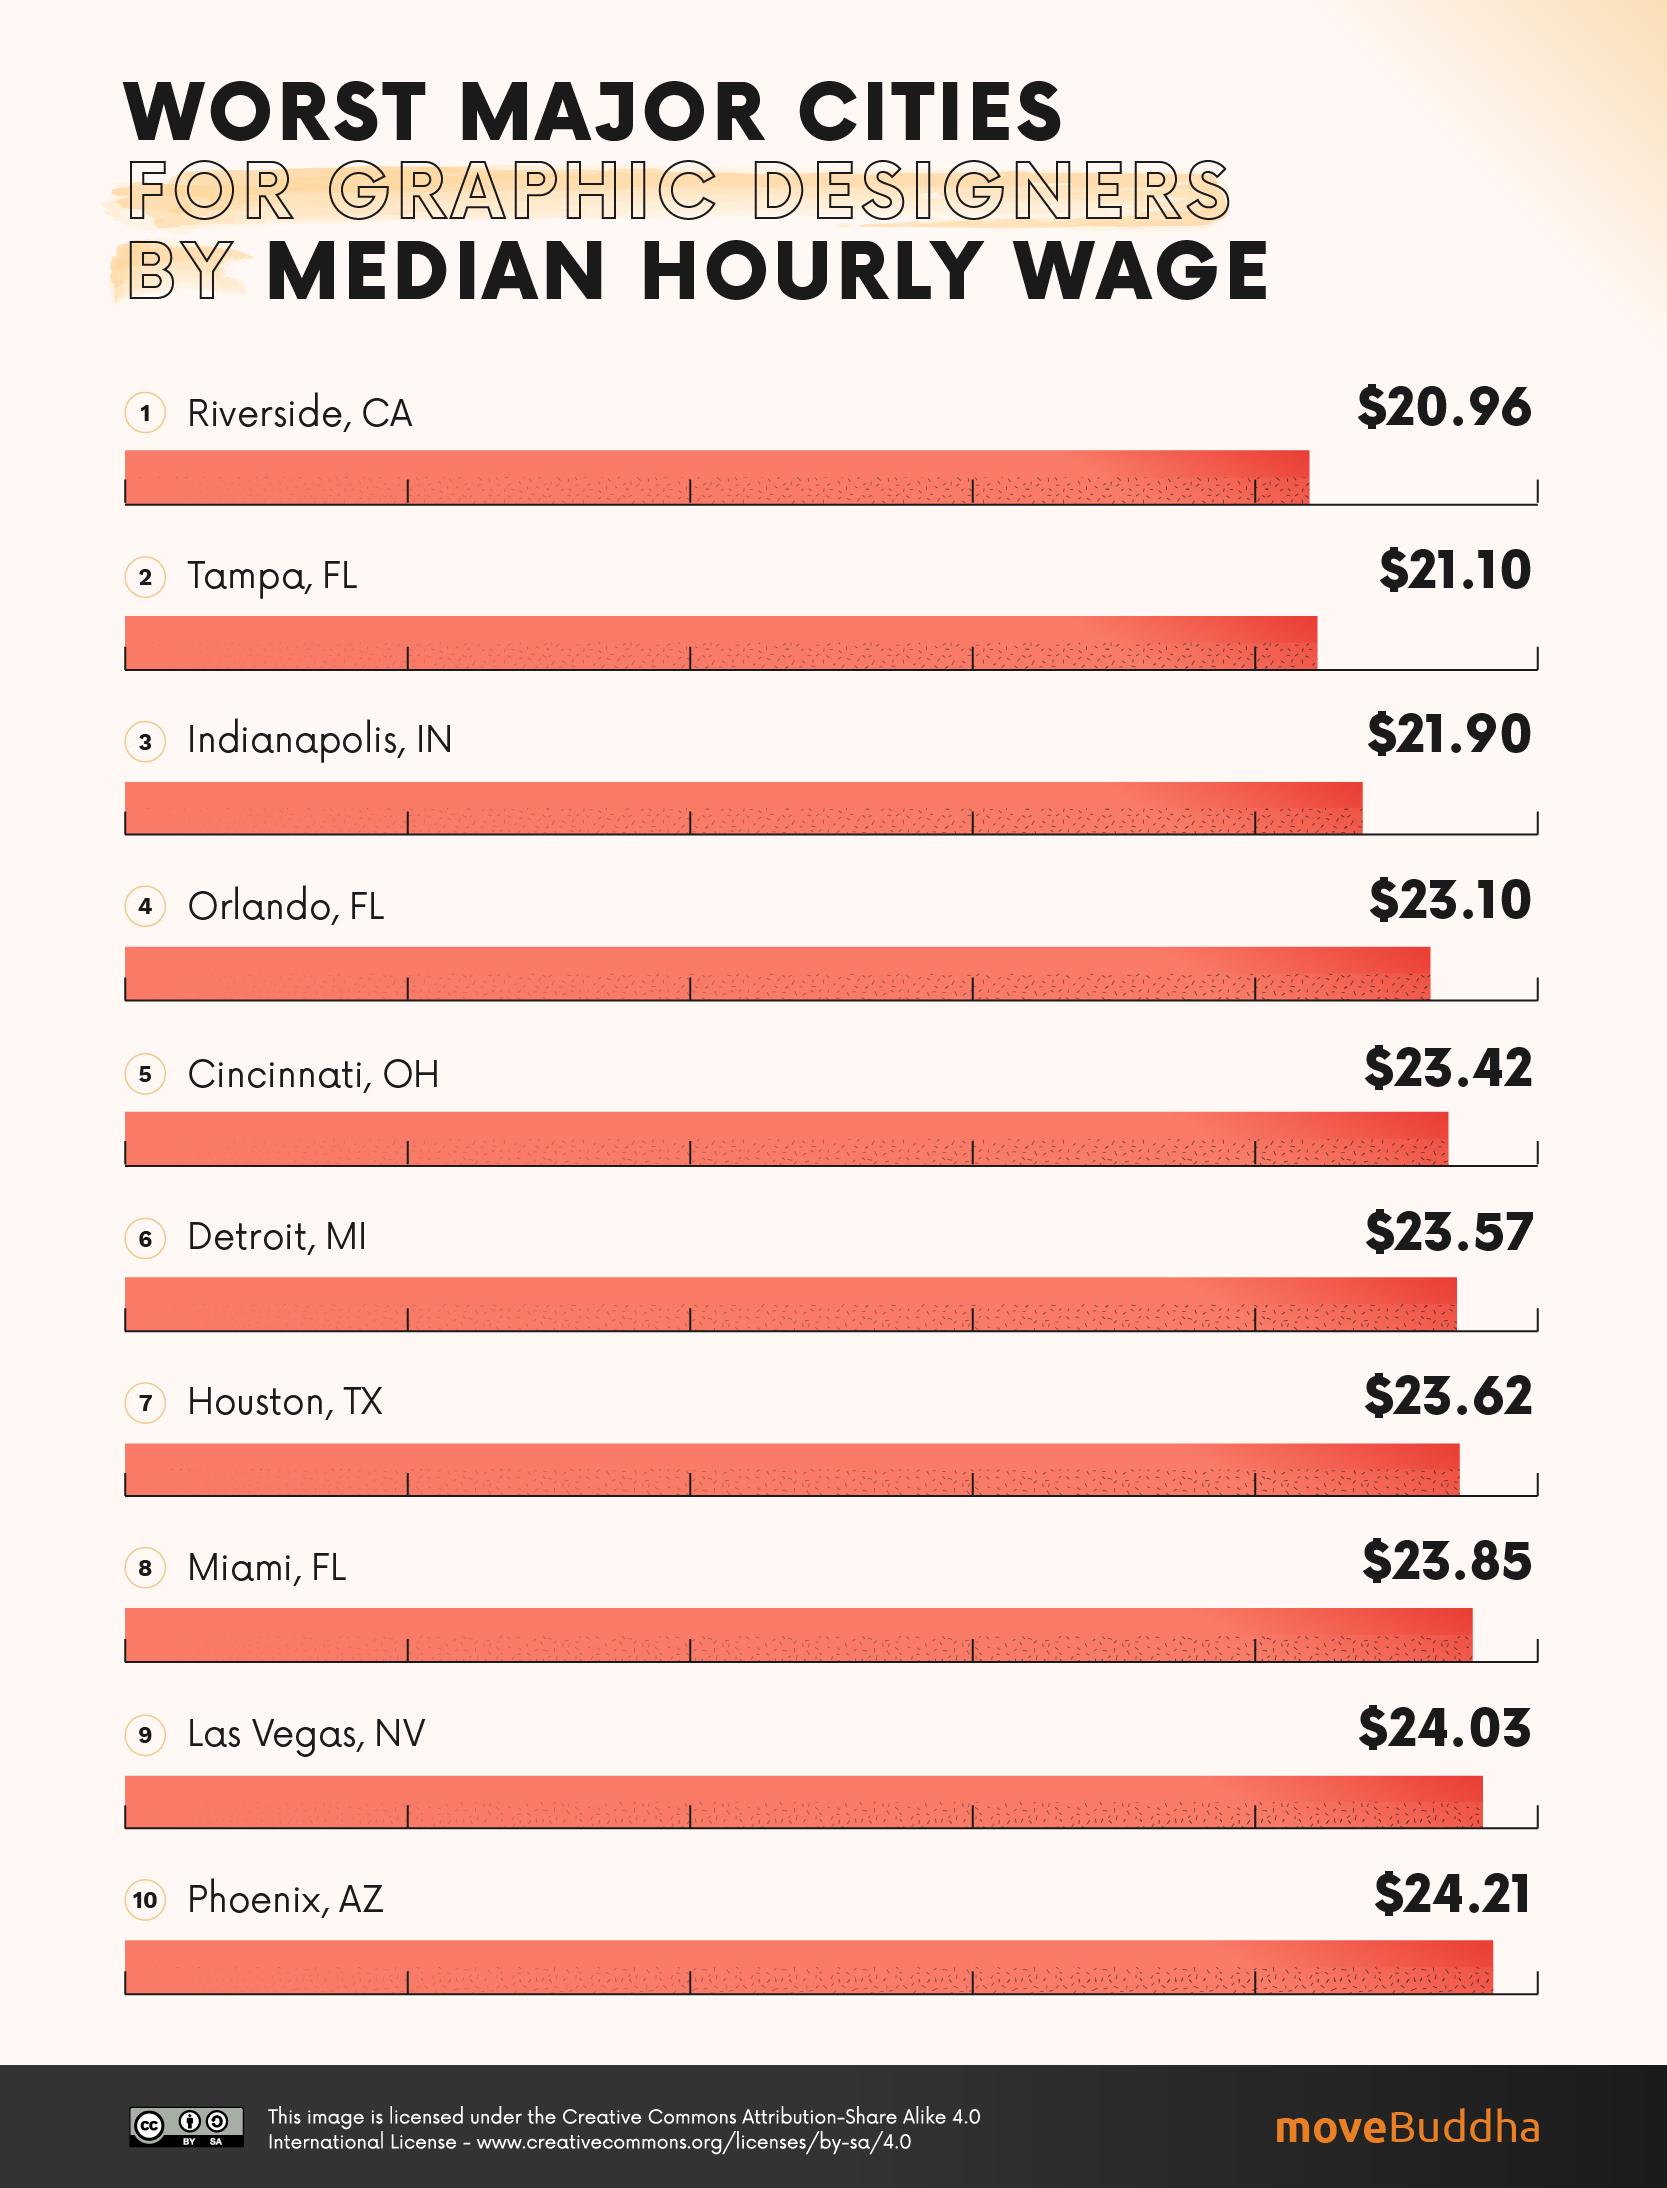
The following cities may have large populations, but they don’t offer graphic designers great earning potential. Consider that you may earn less money as a graphic designer in one of the following cities:
Worst Major Cities (2 million + residents) for Graphic Designers by Median Hourly Wage
| City | Median Hourly Wage | Population 2019 | Real Value of $100 | Location Quotient | |
| 1 | Riverside, CA | $20.96 | 4,650,631 | $ 93.20 | 0.68 |
| 2 | Tampa, FL | $21.10 | 3,194,831 | $ 101.21 | 1.23 |
| 3 | Indianapolis, IN | $21.90 | 2,074,537 | $ 109.77 | 0.99 |
| 4 | Orlando, FL | $23.10 | 2,608,147 | $ 101.01 | 1.19 |
| 5 | Cincinnati, OH | $23.42 | 2,221,208 | $ 110.38 | 1.22 |
| 6 | Detroit, MI | $23.57 | 4,319,629 | $ 104.93 | 0.92 |
| 7 | Houston, TX | $23.62 | 7,066,141 | $ 98.33 | 0.64 |
| 8 | Miami, FL | $23.85 | 6,166,488 | $ 89.53 | 1.28 |
| 9 | Las Vegas, NV | $24.03 | 2,266,715 | $ 103.20 | 0.88 |
| 10 | Phoenix, AZ | $24.21 | 4,948,203 | $ 101.32 | 0.79 |
Worst Large Cities for Graphic Designers by Median Hourly Wage
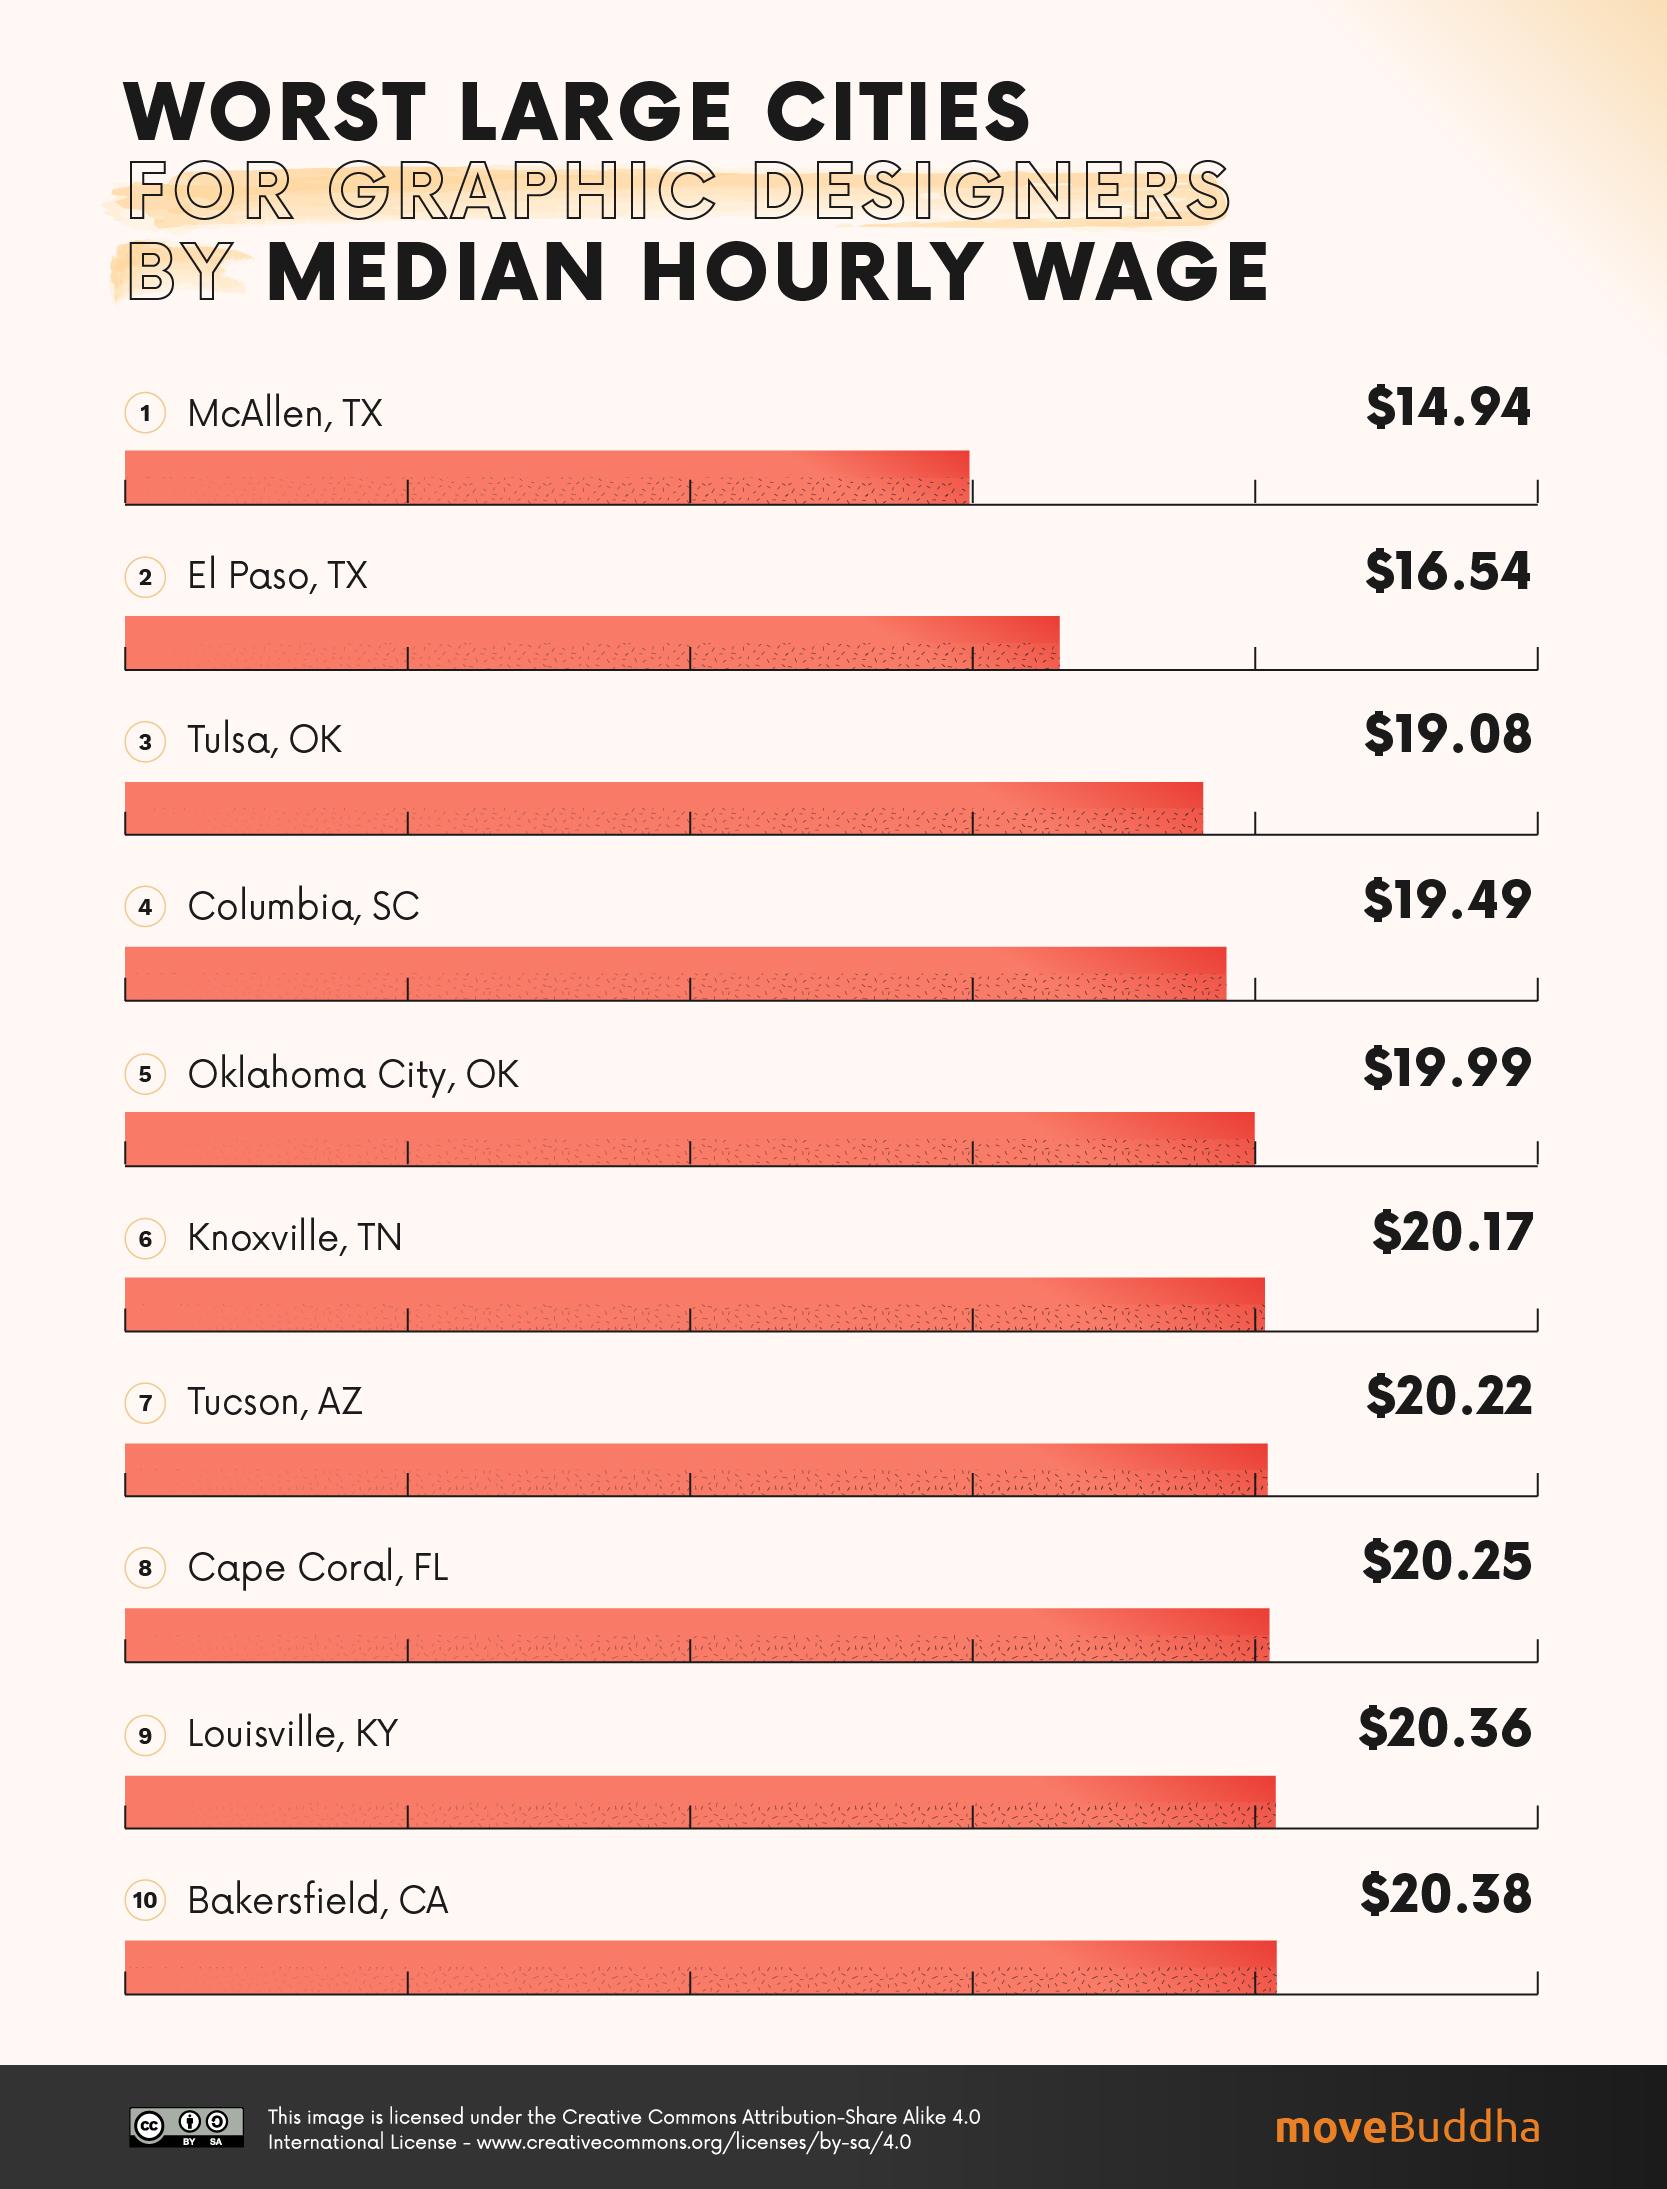
| City | Median Hourly Wage | Population 2019 | Real Value of $100 | Location Quotient | |
| 1 | McAllen, TX | $14.94 | 868,707 | $ 121.65 | 0.39 |
| 2 | El Paso, TX | $16.54 | 844,124 | $ 114.03 | 0.52 |
| 3 | Tulsa, OK | $19.08 | 998,626 | $ 112.87 | 0.75 |
| 4 | Columbia, SC | $19.49 | 838,433 | $ 109.41 | 0.75 |
| 5 | Oklahoma City, OK | $19.99 | 1,408,950 | $ 111.36 | 0.89 |
| 6 | Knoxville, TN | $20.17 | 869,046 | $ 113.12 | 0.78 |
| 7 | Tucson, AZ | $20.22 | 1,047,279 | $ 107.41 | 0.92 |
| 8 | Cape Coral, FL | $20.25 | 770,577 | $ 102.35 | 0.91 |
| 9 | Louisville, KY | $20.36 | 1,265,108 | $ 111.61 | 1.07 |
| 10 | Bakersfield, CA | $20.38 | 900,202 | $ 103.09 | 0.52 |
In which American cities do graphic designers have the greatest spending power?
While it is certainly important to consider how much you can expect to be paid before relocating for your graphic design career, it is equally important to understand how this wage stacks up against the cost-of-living in your area. In a low cost-of-living area, a salary that seems paltry may be stretched considerably farther than you’d expect, where an expensive city quickly may eat up your large paycheck.
If you prioritize a healthy work-life balance or have big plans for your paycheck, the following list is for you.
This list contains ten cities of all sizes, each with above-average employment quotients for graphic designers. The cities are ranked by the fewest number of hours a graphic designer would need to work in order to earn $100 of spending power within the local economy.
Best Cities for Graphic Designers by Spending Power
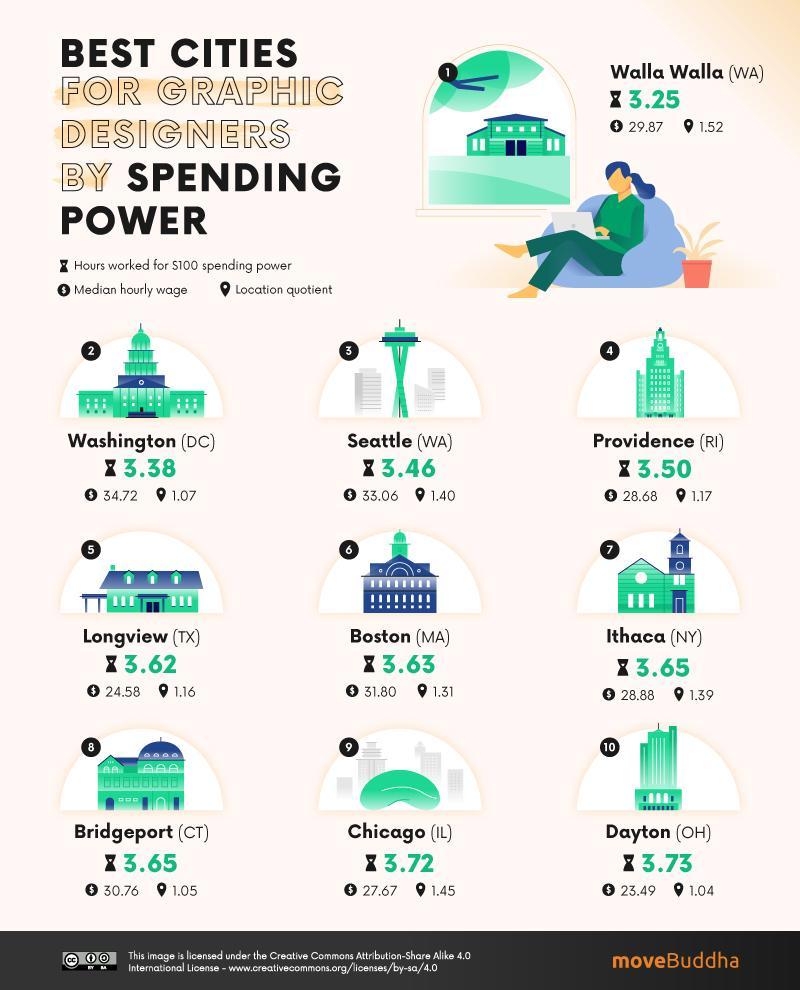
| City | Population | Hours worked for $100 spending power | Median Hourly Wage | Real Value of $100 | Location Quotient | |
| 1 | Walla Walla, WA | 60,760 | 3.25 | $29.87 | $ 102.88 | 1.52 |
| 2 | Washington, DC | 6,280,487 | 3.38 | $34.72 | $ 85.18 | 1.07 |
| 3 | Seattle, WA | 3,979,845 | 3.46 | $33.06 | $ 87.34 | 1.4 |
| 4 | Providence, RI | 1,624,578 | 3.50 | $28.68 | $ 99.70 | 1.17 |
| 5 | Longview, TX | 286,657 | 3.62 | $24.58 | $ 112.23 | 1.16 |
| 6 | Boston, MA | 4,873,019 | 3.63 | $31.80 | $ 86.58 | 1.31 |
| 7 | Ithaca, NY | 102,180 | 3.65 | $28.88 | $ 94.97 | 1.39 |
| 8 | Bridgeport, CT | 943,332 | 3.65 | $30.76 | $ 88.97 | 1.05 |
| 9 | Chicago, IL | 9,458,539 | 3.72 | $27.67 | $ 97.28 | 1.45 |
| 10 | Dayton, OH | 807,611 | 3.73 | $23.49 | $ 114.16 | 1.04 |
You may not be able to get by working just part-time as a graphic designer in the cities listed next. Here we’ve assembled the ten worst American cities for graphic designers in terms of spending power. All cities in this list have an above-average location quotient — so the jobs exist — but will have you working extra hours to make ends meet. Only cities with populations larger than 250,000 appear in this list.
Worst Cities for Graphic Designers by Spending Power
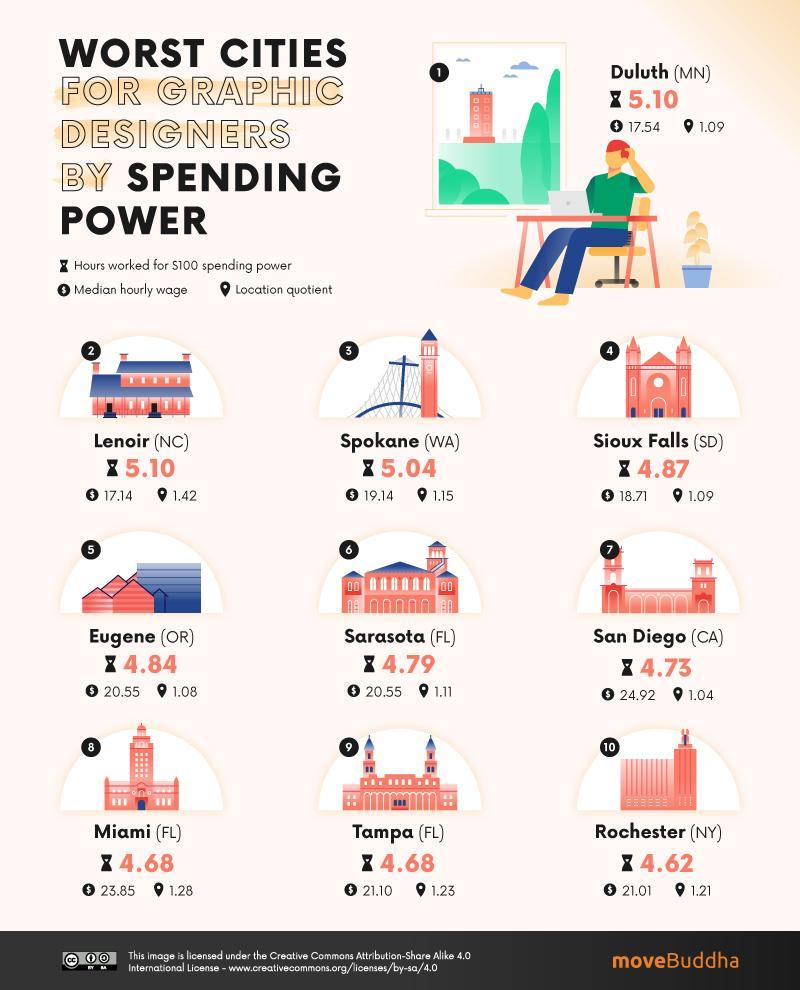
| City | Population | Hours worked for $100 spending power | Median Hourly Wage | Real Value of $100 | Location Quotient | |
| 1 | Duluth, MN | 288,732 | 5.10 | $17.54 | $ 111.73 | 1.09 |
| 2 | Lenoir, NC | 369,711 | 5.10 | $17.14 | $ 114.42 | 1.42 |
| 3 | Spokane, WA | 568,521 | 5.04 | $19.14 | $ 103.63 | 1.15 |
| 4 | Sioux Falls, SD | 268,232 | 4.87 | $18.71 | $ 109.65 | 1.09 |
| 5 | Eugene, OR | 382,067 | 4.84 | $20.55 | $ 100.60 | 1.08 |
| 6 | Sarasota, FL | 836,995 | 4.79 | $21.03 | $ 99.21 | 1.11 |
| 7 | San Diego, CA | 3,338,330 | 4.73 | $24.92 | $ 84.82 | 1.04 |
| 8 | Miami, FL | 6,166,488 | 4.68 | $23.85 | $ 89.53 | 1.28 |
| 9 | Tampa, FL | 3,194,831 | 4.68 | $21.10 | $ 101.21 | 1.23 |
| 10 | Rochester, NY | 1,069,644 | 4.62 | $21.01 | $ 102.99 | 1.21 |
Source Data: https://drive.google.com/file/d/1oJa1skG-Y6o4oHdUUyeSZP5GbxEzxqcD/view?usp=sharing
Not what you were looking for?
Check out other categories that can help you find the information you need!

